

Abstract
Respiratory mechanics refers to the expression of lung function through measures of pressure and flow. From these measurements, a variety of derived indices can be determined, such as volume, compliance, resistance, and work of breathing. Plateau pressure is a measure of end-inspiratory distending pressure. It has become increasingly appreciated that end-inspiratory transpulmonary pressure (stress) might be a better indicator of the potential for lung injury than plateau pressure alone. This has resulted in a resurgence of interest in the use of esophageal manometry in mechanically ventilated patients. End-expiratory transpulmonary pressure might also be useful to guide the setting of PEEP to counterbalance the collapsing effects of the chest wall. The shape of the pressure-time curve might also be useful to guide the setting of PEEP (stress index). This has focused interest in the roles of stress and strain to assess the potential for lung injury during mechanical ventilation. This paper covers both basic and advanced respiratory mechanics during mechanical ventilation.
- auto-PEEP
- chest wall
- compliance
- esophageal pressure
- mechanical ventilation
- plateau pressure
- resistance
- respiratory mechanics
- work of breathing
Introduction
Respiratory mechanics refers to the expression of lung function through measures of pressure and flow.1,2 From these measurements, a variety of derived indices can be determined, such as volume, compliance, resistance, and work of breathing (WOB). Waveforms are derived when one of the parameters of respiratory mechanics is plotted as a function of time or as a function of one of the other parameters. This produces scalar tracings of pressure-time, flow-time, and volume-time graphics, as well as flow-volume and pressure-volume (P-V) loops. All current-generation positive-pressure ventilators provide some monitoring of pulmonary mechanics and graphics in real time at the bedside. When interpreting these measurements, it is important to remember that bedside monitoring of mechanics and graphics during positive-pressure ventilation portrays the lungs as a single compartment and assumes a linear response over the range of tidal volume (VT). Although this is a physiologic oversimplification, the information nonetheless is useful to evaluate lung function, assess response to therapy, and optimize mechanical ventilator support. An evaluation of respiratory mechanics allows the best available evidence to be individualized to the patient. By necessity, any discussion of respiratory mechanics involves mathematics. Fortunately, much of the mathematics is basic algebra, and for the most part, I will stick to that in this paper.
Pressure
Airway Pressure
Airway pressure is measured universally during mechanical ventilation. Pressure is measured ideally at the proximal airway, but most ventilators do not because proximal airway pressure monitoring exposes the sensor to secretions and carries other technical issues.3 Alternatively, the ventilator can measure pressure proximal to the expiratory valve during the inspiratory phase to approximate inspiratory proximal airway pressure, and it can measure pressure distal to the inspiratory valve during the expiratory phase to approximate expiratory proximal airway pressure. Because flow in the expiratory limb is zero during the inspiratory phase and flow in the inspiratory limb is zero during the expiratory phase, pressures measured in this manner should approximate proximal airway pressure.
Airway pressure is typically displayed on the ventilator screen as a function of time. The shape of the airway pressure waveform is determined by flow and VT from the ventilator, lung mechanics, and any active breathing efforts of the patient.
Equation of Motion

Airway pressure is predicted mathematically by the equation of motion:(1)where Pvent is the proximal airway pressure applied by the ventilator, Pmus is the pressure generated by the patient’s inspiratory muscles, VT is tidal volume, CRS is respiratory system compliance, Raw is airway resistance, V̇I is inspiratory flow, PEEP is the PEEP set on the ventilator, and PEEPi is intrinsic PEEP (auto-PEEP). The inertance variable, representing the effect of inertia, is assumed to be low and thus disregarded.
Raw and CRS can be obtained by fitting the equation of motion to P, V, and V̇ with a multiple linear regression analysis, called linear least-squares fitting.4 This approach is incorporated into the software of some ventilators, allowing display of Raw, CRS, and auto-PEEP without the need for inspiratory and expiratory pause maneuvers. P, V, and V̇ are digitized at 100 Hz, allowing Raw and CRS be calculated from 100 or more equations per breath. This method can be applied during the whole breathing cycle or only in the inspiratory or expiratory phase, although restricting the analysis to the inspiratory phase may be more appropriate in patients with COPD who have flow limitation. The least-squares fitting method assumes that Pmus is zero and is thus less valid if the patient is actively breathing. An important methodological issue is that the least-squares fitting approach uses a single linear model that does not take into account changes of Raw and CRS with lung volume, and it also neglects flow turbulence and inertial forces.
Alveolar Pressure
During volume control ventilation, alveolar pressure (Palv) at any time during inspiration is determined by the volume delivered and CRS: Palv = V/CRS + PEEP. For pressure control ventilation, Palv at any time after the initiation of inspiration is: Palv = ΔP × (1 − e−t/τ) + PEEP, where ΔP is the pressure applied to the airway above PEEP, e is the base of the natural logarithm, t is the elapsed time after initiation of the inspiratory phase, and τ is the time constant.
Plateau Pressure
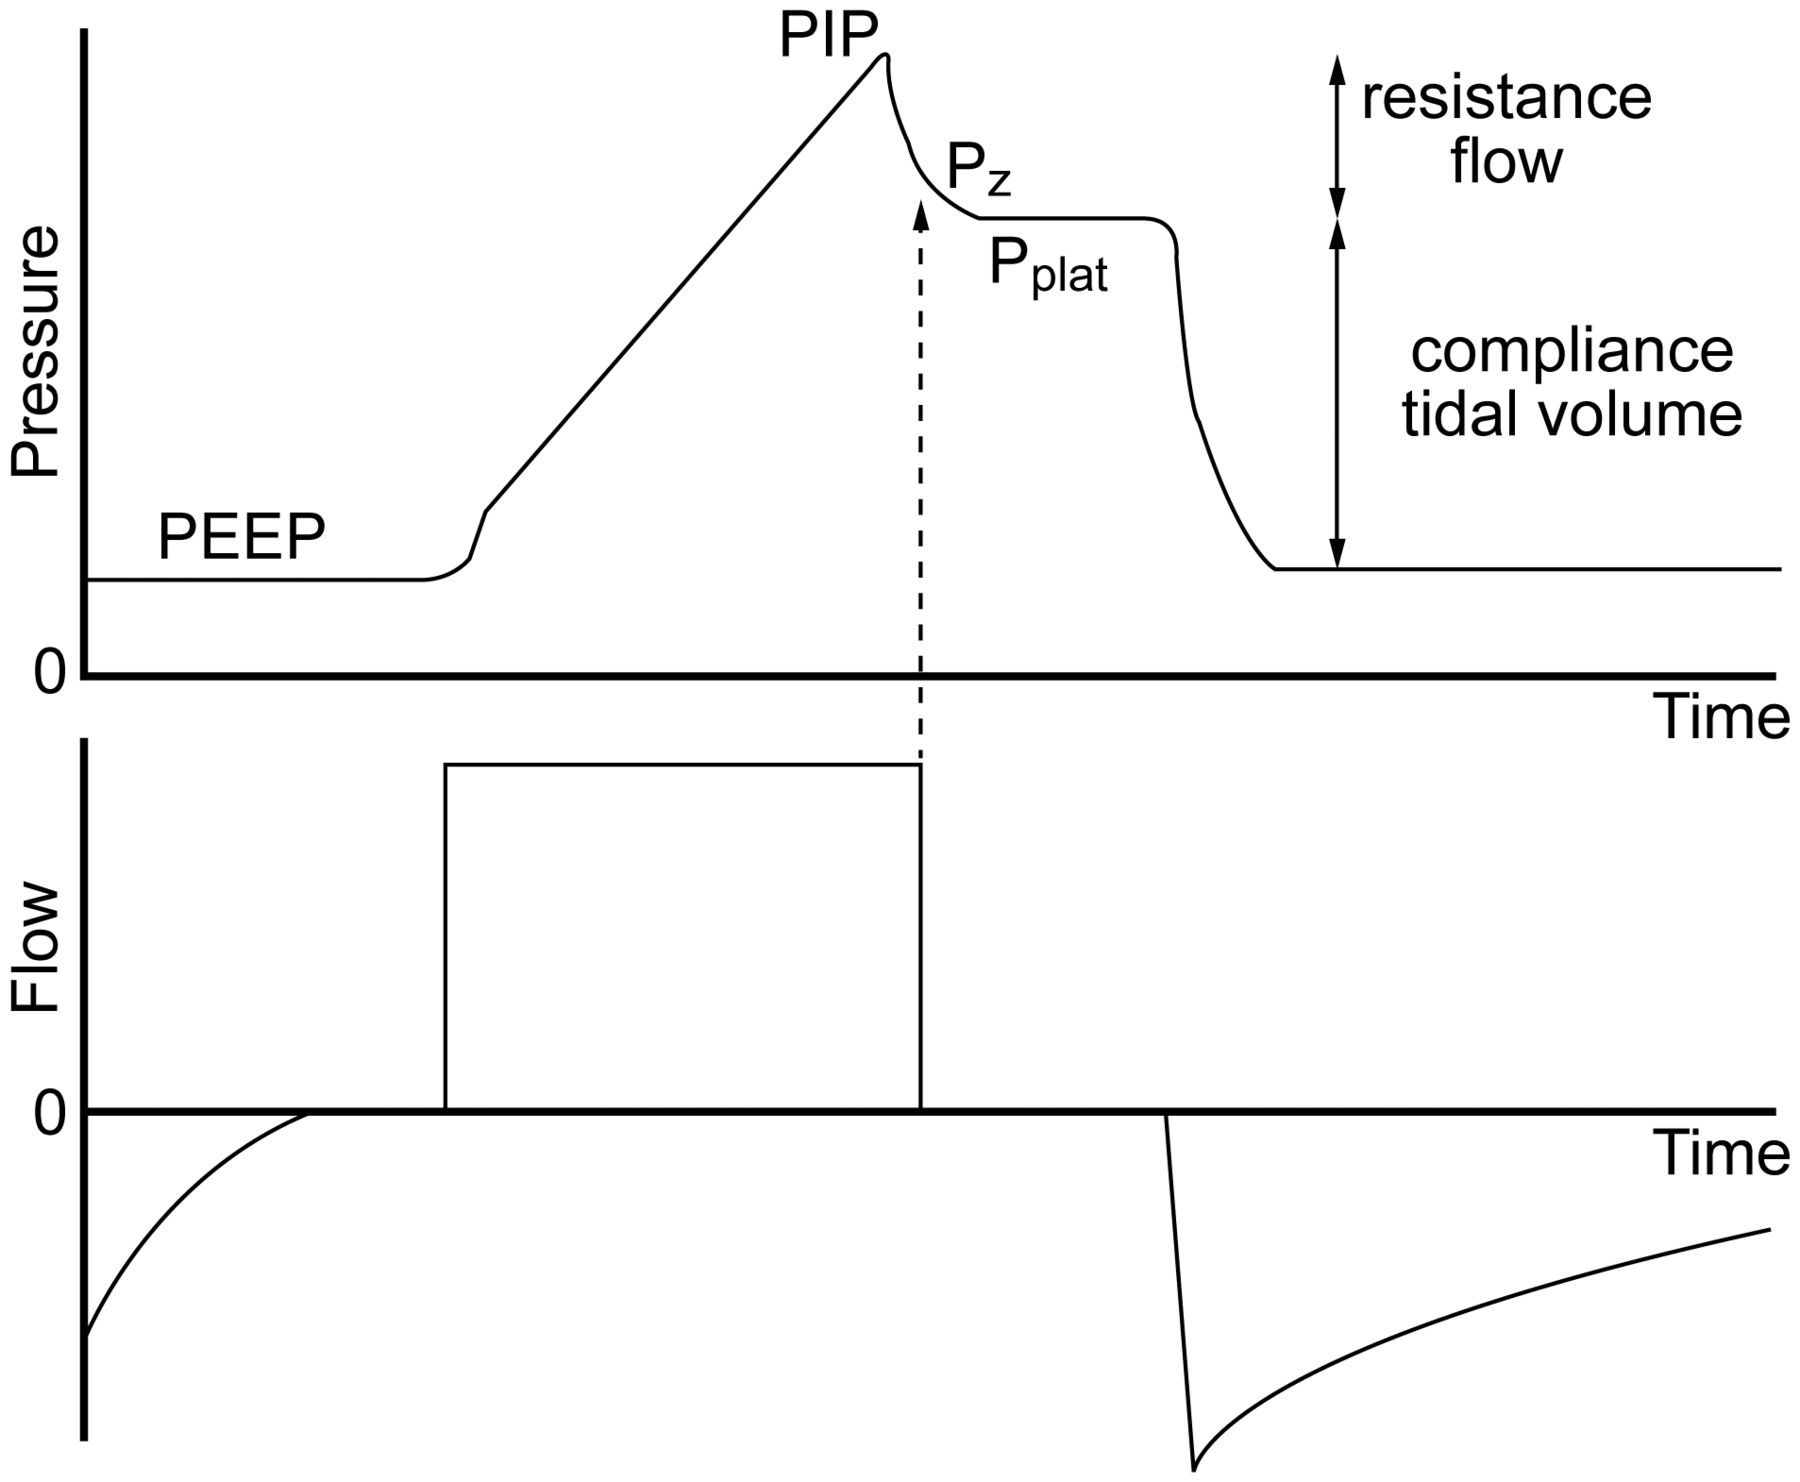
Due to Raw, proximal airway pressure will always be greater than Palv during inspiration if flow is present. Palv is estimated with an end-inspiratory hold maneuver. Plateau pressure (Pplat) is measured during mechanical ventilation by applying an end-inspiratory breath-hold for 0.5–2 s, during which pressure equilibrates throughout the system, so the pressure measured at the proximal airway approximates the Palv (Fig. 1).
Fig. 1.
Airway pressure and flow waveforms during constant flow volume control ventilation, illustrating the effect of an end-inspiratory breath-hold. With a period of no flow, the pressure equilibrates to the plateau pressure (Pplat). Pplatrepresents the peak alveolar pressure. The difference between Pz and Pplat is due to time constant inhomogeneity within the lungs. The difference between the peak inspiratory pressure (PIP) and Pplat is determined by resistance and flow. The difference between Pplat and PEEP is determined by tidal volume and respiratory system compliance. Pz = pressure at zero flow.
With rapid airway occlusion at the end of inspiration, flow drops to zero, and the proximal airway pressure immediately decreases to a lower level (the pressure at zero flow [Pz]). Raw and end-inspiratory flow determine the difference between peak inspiratory pressure (PIP) and Pz. During airway occlusion, pressure further declines to reach a plateau (Pplat). The difference between Pz and Pplat is determined by time constant heterogeneity within the lungs (ie, pendelluft) and the viscoelastic behavior of the stress relaxation of the pulmonary tissues. Measurement of Pplat is valid only during passive inflation of the lungs, but not during active breathing. During pressure control ventilation, the flow might decrease to zero at the end of the inspiratory phase; if this occurs, PIP and Pplat are equal.
Pplat is determined by VT and CRS during full ventilatory support: Pplat = VT/CRS. A high Pplatindicates risk of alveolar over-distention. Pplat should ideally be kept at ≤ 30 cm H2O,5 with some evidence suggesting that Pplat should be targeted to < 25 cm H2O in patients with ARDS.6,7 This assumes that chest-wall compliance (CCW) is normal. A high Pplat may be safe (and necessary) if CCW is decreased.

A method has been described that uses the expiratory time constant (τE) to provide real-time determinations of Pplat without the need for an end-inspiratory pause maneuver.8 Using this approach, τE is estimated from the slope of the passive expiratory flow curve between 0.1 and 0.5 s. Pplat is then calculated as:(2)This approach has the advantage of being able to be used in spontaneous breathing modes such as pressure support, but has the disadvantage of requiring a computerized algorithm to make the necessary calculations.
Auto-PEEP
Incomplete emptying of the lungs occurs if the expiratory phase is terminated prematurely. The pressure produced by this trapped gas is called auto-PEEP, intrinsic PEEP, or occult PEEP. Auto-PEEP increases end-expiratory lung volume and thus causes dynamic hyperinflation.9,10
Auto-PEEP is measured by applying an end-expiratory pause for 0.5–2 s (Fig. 2). The pressure measured at the end of this maneuver in excess of the PEEP set on the ventilator is defined as auto-PEEP. For a valid measurement, the patient must be relaxed and breathing in synchrony with the ventilator, as active breathing invalidates the measurement. The end-expiratory pause method can underestimate auto-PEEP when some airways close during exhalation, as may occur during ventilation of the lungs of patients with severe asthma (Fig. 3). In spontaneously breathing patients, measurement of esophageal pressure (Pes) can be used to determine auto-PEEP (Fig. 4).
Fig. 2.
Applying an end-expiratory breath-hold allows measurement of end-expiratory alveolar pressure. The difference between PEEP set and the pressure measured during this maneuver is the amount of auto-PEEP. PIP = peak inspiratory pressure.
Fig. 3.
As illustrated here, the measured auto-PEEP can be considerably less than the auto-PEEP in some lung regions if airways collapse during exhalation.
Fig. 4.
Airway pressure, flow, volume, and esophageal pressure (Pes) waveforms in a patient with auto-PEEP. Note the decrease in Pes required to trigger the ventilator, which represents the amount of auto-PEEP. Also note that flow does not return to zero at the end of exhalation, and the inspiratory effort does not trigger the ventilator.
Auto-PEEP is a function of ventilator settings (VT and expiratory time [TE]) and lung function (Rawand lung compliance [CL]): auto-PEEP = VT/(CRS × (eKx × TE − 1), where Kx is the inverse of the τE (1/τ). Note that auto-PEEP is increased with increased resistance and compliance, increased breathing frequency or increased inspiratory time (TI; both decrease TE), and increased VT. Clinically, auto-PEEP can be decreased by decreasing minute ventilation (rate or VT), increasing TE(decreasing rate or TI), or decreasing Raw (eg, bronchodilator administration).
Mean Airway Pressure
Mean airway pressure (P̄aw) is determined by PIP, the fraction of time devoted to the inspiratory phase (TI/Ttot, where Ttot is total respiratory cycle time), and PEEP. For constant flow-volume ventilation, in which the airway pressure waveform is triangular, P̄aw can be calculated as: P̄aw = 0.5 × (PIP − PEEP) × (TI/Ttot) + PEEP. During pressure ventilation, in which the airway pressure waveform is rectangular, P̄aw can be estimated as: P̄aw = (PIP − PEEP) × (TI/Ttot) + PEEP. The mean Palv may be different than P̄aw if the inspiratory airway resistance (RI) and expiratory airway resistance (RE) are different, which is often the case in lung disease: mean Palv = P̄aw + (V̇E/60) × (RE − RI), where V̇E is expiratory flow.
Esophageal Pressure
Pleural pressure (Ppl) cannot be easily measured directly. The traditional approach to assess Ppl is the use of an esophageal balloon,11–18 which consists of a thin catheter with multiple small holes in the distal 5–7 cm of its length. A 10-cm-long balloon is placed over the distal end of the catheter to prevent the holes in the catheter from being occluded by esophageal tissue and secretions, and the balloon is inflated with a small amount of air (0.5 mL). The proximal end of the catheter is attached to a pressure transducer.
The catheter is inserted orally or nasally to ∼35–40 cm from the airway opening. Correct positioning of the esophageal balloon is necessary to ensure accurate Pes measurements. After the balloon is inflated and the pressure is measured, the Pes waveform should be compared to the airway pressure waveform. If they appear similar in pressure and shape, the catheter is likely in the trachea and should be removed. If the catheter is in the esophagus, cardiac oscillations should be visible on the Pes waveform, indicating that the balloon is positioned in the lower third of the esophagus directly behind the heart (Fig. 5). Some clinicians use a technique in which the catheter is intentionally inserted into the stomach, air is added to the balloon, and the catheter is then withdrawn until cardiac oscillations are observed.
Fig. 5.
Illustrated here are several features used to determine that the esophageal balloon is correctly placed in the esophagus. Notice the presence of cardiac oscillations on the esophageal pressure waveform. Also note that there is no change in transpulmonary pressure when pressure is applied to the abdomen.
The classic technique used to validate the balloon’s position requires the patient to perform static Valsalva and Müller maneuvers with the glottis open. In patients unable to cooperate, changes in Pes and airway pressure are assessed during a gentle push on the abdomen with the airway occluded. Airway occlusion is accomplished using the expiratory pause control on the ventilator. When changes in Pes are equal to airway pressure, it is assumed that transmission of Ppl to Pes is unimpeded, and Pes accurately reflects Ppl. A chest radiograph can also be used to validate correct positioning (Fig. 6),19 but this is usually not necessary.
Fig. 6.
Left: Correct positioning of the esophageal balloon, ∼40 cm from the lips. Center: Chest radiograph showing correct balloon placement (arrow). Right: Note that the esophagus borders the pleural space in the mid-thorax (arrows). Left and center images from Reference 19.
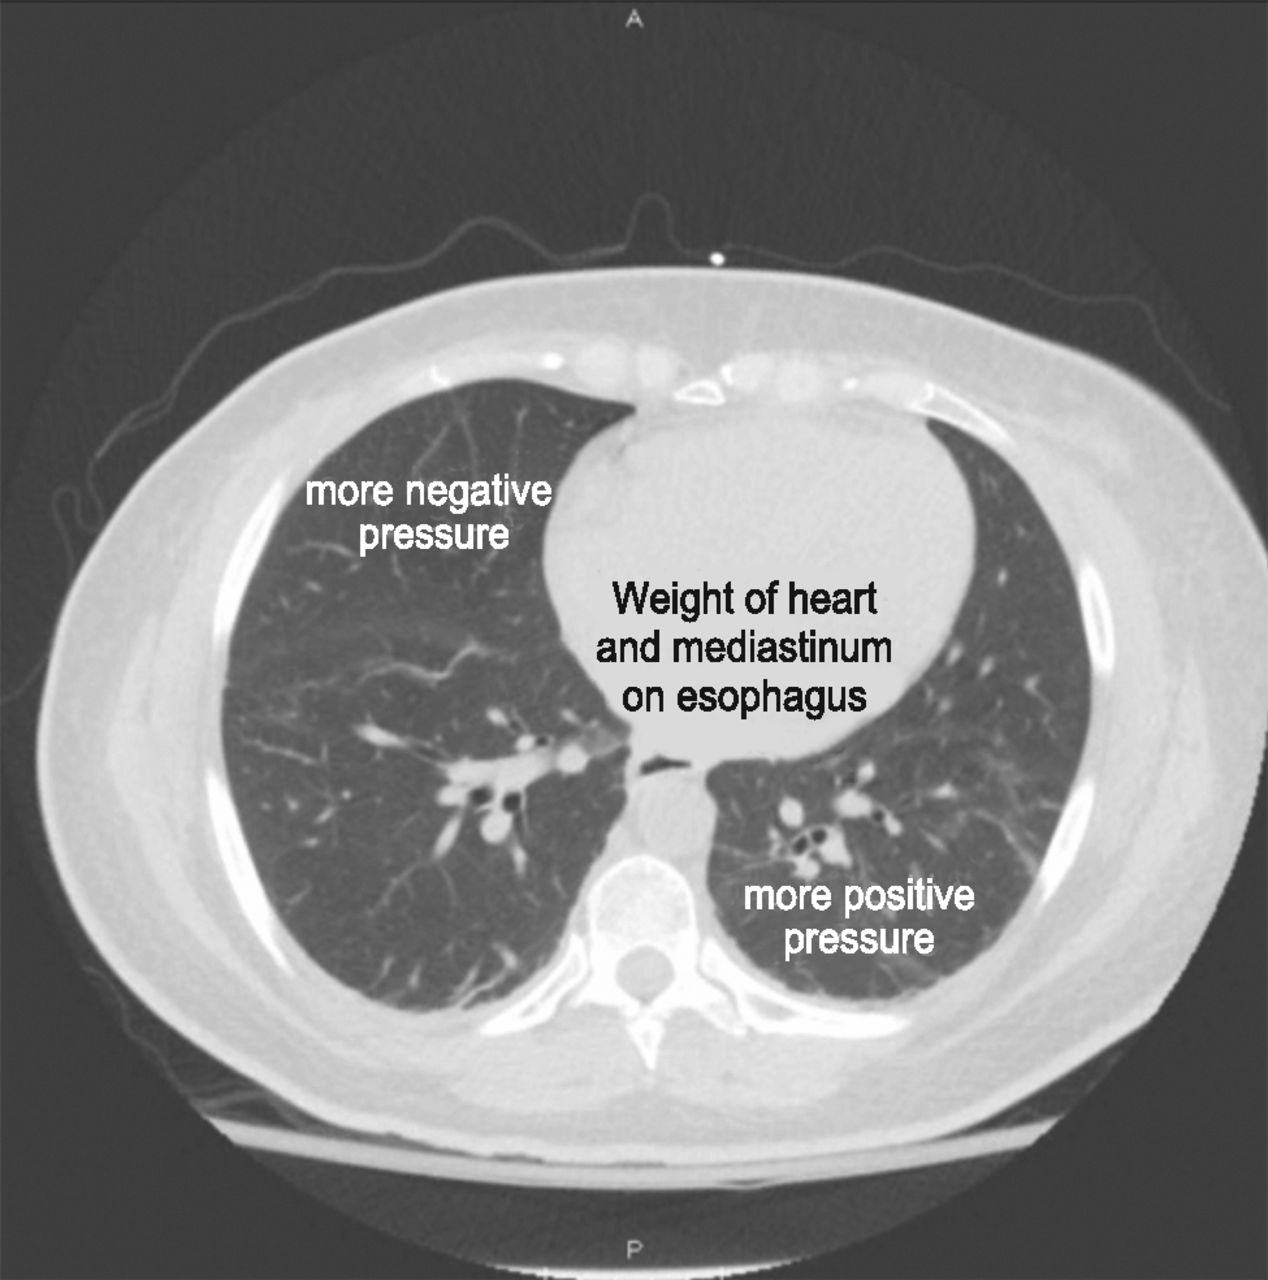
There are potential sources of error in the use of Pes to estimate Ppl.12,20 It is important to appreciate that the Pes estimates Ppl mid-thorax. The Ppl is more negative in the non-dependent thorax and more positive in the dependent thorax (Fig. 7). The weight of the heart can bias the Pesby as much as 5 cm H2O.16 The results of Guérin and Richard21 suggest that referencing absolute Pes values to those obtained at the relaxation volume of the respiratory system might improve the customization of the correction of Pes based on the physiologic and individual context, rather than using an invariant value of 5 cm H2O.
Fig. 7.
Several potential sources of error in esophageal manometry are illustrated in this transverse section of the thorax. The esophageal pressure estimated pleural pressure (Ppl) at mid-thorax. The Ppl is more negative in the non-dependent thorax and less negative in the dependent thorax. Additionally, the weight of the heart and mediastinum will increase the pressure measured in the esophagus relative to Ppl.
Transpulmonary Pressure
Transpulmonary pressure (PL) is the difference between pressure measured at the mouth and esophageal (pleural) pressure. During no flow (inspiratory or expiratory pause maneuvers), PLbecomes the alveolar distending pressure. In this paper, the assumption is that PL is measured under static conditions and thus represents alveolar distending pressure. The ventilator should be set to avoid a negative PL during exhalation (contributing to cyclical opening and closing injury) and to avoid excessive PL at the end of inspiration (over-distention).
Intra-Abdominal Pressure
Interactions between the abdominal and thoracic compartments are important considerations in the critically ill patient, as the diaphragm links these compartments.17 If the diaphragm is allowed to freely shift upward into the thorax with increased abdominal pressure, lung volume will be reduced. If lung volume is restored with PEEP, the increased abdominal pressure will result in an increase in intrathoracic pressure. On average, half of the pressure in the intra-abdominal compartment (range of 25–80%) has been noted to be present in the intrathoracic space.22 This wide range in transmitted pressure is likely related to the amount of PEEP that has been applied to restore lung volume. Sindi et al23 evaluated the correlation between esophageal and abdominal pressures in mechanically ventilated subjects undergoing laparoscopic surgery. In those subjects without respiratory disease, there was a significant but limited relationship between esophageal and abdominal pressures. They concluded that intra-abdominal pressure cannot predict Pes, but can provide complementary information useful in setting mechanical ventilation.
Intra-abdominal pressure is the steady-state pressure in the abdominal cavity.22 Normal intra-abdominal pressure is 5 mm Hg; it increases during inhalation with diaphragmatic contraction. Direct measurement of intraperitoneal pressure is the accepted standard for determination of intra-abdominal pressure. This is not practical, however; so the bladder method is thus most commonly used for intermittent intra-abdominal pressure measurement.24 The bladder is a passive structure, transmitting intra-abdominal pressure after infusion of saline volumes of 50–100 mL. Intra-abdominal pressure should be measured at the end of exhalation in the supine position, ensuring that abdominal muscle contractions are absent and that the transducer is zeroed at the mid-axillary line.
In mechanically ventilated patients, an increase in intra-abdominal pressure results in decreased CRS with flattening and a rightward shift of the P-V curve of the respiratory system.22 These changes are due to decreased CCW, whereas CL remains unchanged. A strong positive correlation between intra-abdominal pressure and the lower inflection point of the P-V curve of the respiratory system has also been reported in conditions with increased intra-abdominal pressure, suggesting that intra-abdominal pressure might be correlated with the best PEEP in ventilated patients with ARDS and intra-abdominal hypertension.22 In deeply sedated patients with ARDS, the diaphragm behaves as a passive structure, and thus moves upward in the rib cage, transmits increased intra-abdominal pressure to the lower lobes of the lung, and causes compression atelectasis. Surgical abdominal decompression recruits lung volume and increases in PaO2/FIO2.25 Upright positioning increases intra-abdominal pressure and decreases CRS, suggesting that this position might result in a deterioration of respiratory function in patients with intra-abdominal hypertension.26
Transdiaphragmatic Pressure
Normally during spontaneous inspiration, Ppl decreases and intra-abdominal pressure increases. Transdiaphragmatic pressure (Pdi) represents the pressure across the diaphragm, the difference between abdominal pressure (Pab) and Ppl: Pdi = Pab − Ppl. Abdominal pressure is measured from a catheter in the stomach (gastric pressure), and Ppl is measured as Pes. Sharshar et al27 reported that Pdi-driven servo ventilation was well synchronized to the subjects’ effort, delivering a pressure proportional to Pdi and reducing respiratory effort at normocapnia and hypercapnia. Although this approach has physiologic intrigue, it might not be practical for routine clinical use.
Abdominal paradox is a clinical sign of diaphragm paralysis. In this circumstance, both esophageal and gastric pressures have a negative deflection during inspiration, suggestive of diaphragmatic paralysis (Fig. 8).28
Fig. 8.
Esophageal and gastric pressures. Positive flow represents inhalation, and negative flow represents exhalation. Both esophageal and gastric pressures decrease during inhalation, consistent with diaphragmatic paralysis. From Reference 28, with permission.
Asynchrony
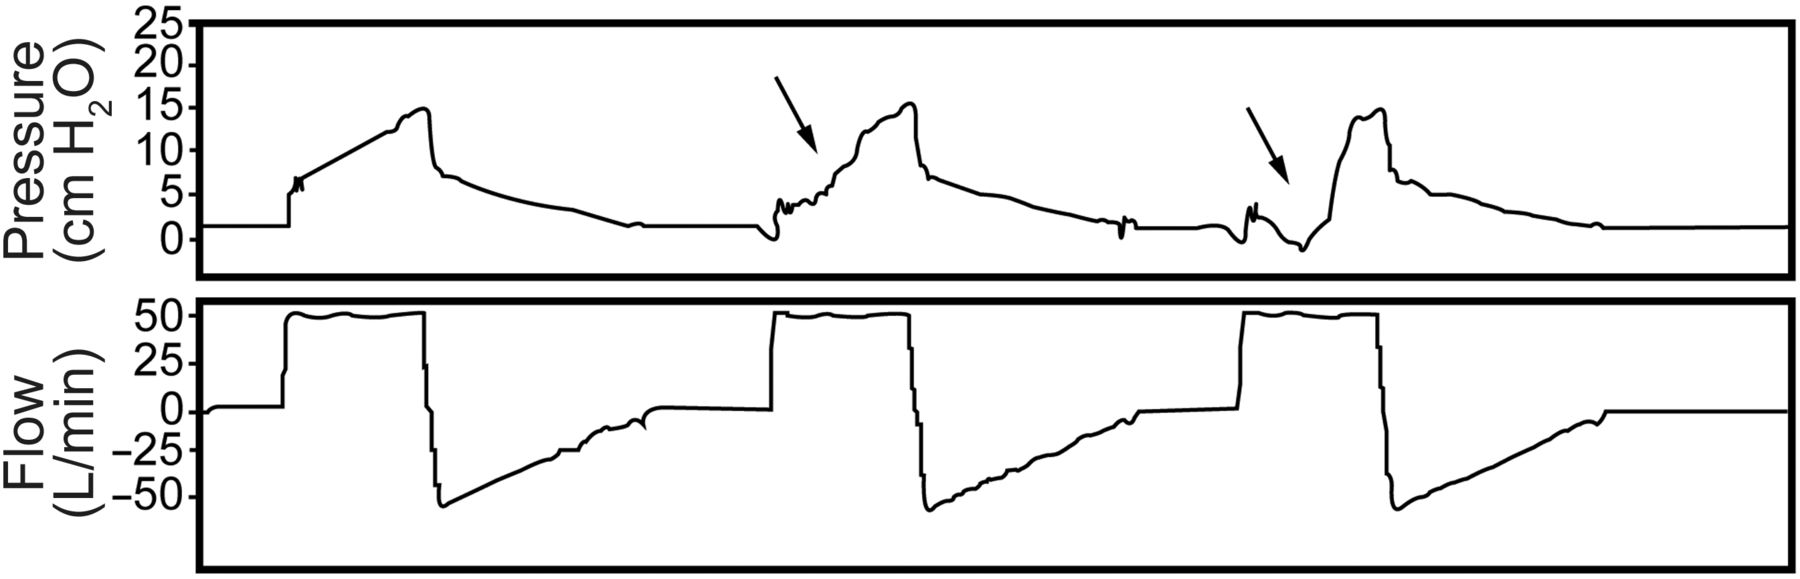
Patient-ventilator asynchrony results in an airway pressure waveform that varies from breath to breath, particularly during volume control ventilation (Fig. 9).29 A special form of patient-ventilator asynchrony can occur during pressure support ventilation, in which the patient actively exhales to terminate the inspiratory phase. This is seen as a pressure spike at the end of inspiration, causing the ventilator to pressure-cycle to the expiratory phase. It is important to judge the presence of asynchrony when assessing respiratory mechanics, as this has the potential to bias assessments of respiratory mechanics such as Pplat and stress index.
Fig. 9.
Effect of asynchrony on the airway pressure waveform during volume control ventilation. The arrows indicate a decrease in airway pressure due to the fixed flow from the ventilator and the increased patient effort. From Reference 29.
Stress Index
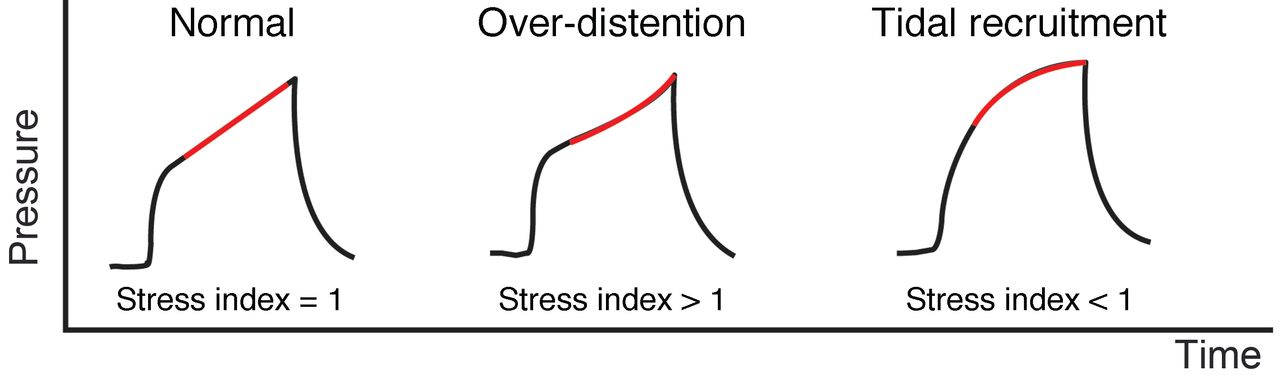
The stress index is used to assess the shape of the pressure-time curve during constant flow-volume control ventilation (Fig. 10).30 A linear increase in pressure (constant compliance, stress index = 1) suggests adequate alveolar recruitment without over-distention. If compliance worsens as the lungs are inflated (progressive decrease in compliance, upward concavity, stress index > 1), this suggests over-distention, and the recommendation is to decrease the PEEP, VT, or both. If compliance improves as the lungs are inflated (progressive increase in compliance, downward concavity, stress index < 1), this suggests tidal recruitment and potential for additional recruitment, and the recommendation is to increase PEEP.
Fig. 10.
Normal stress index, stress index with over-distention, and stress index with tidal recruitment.
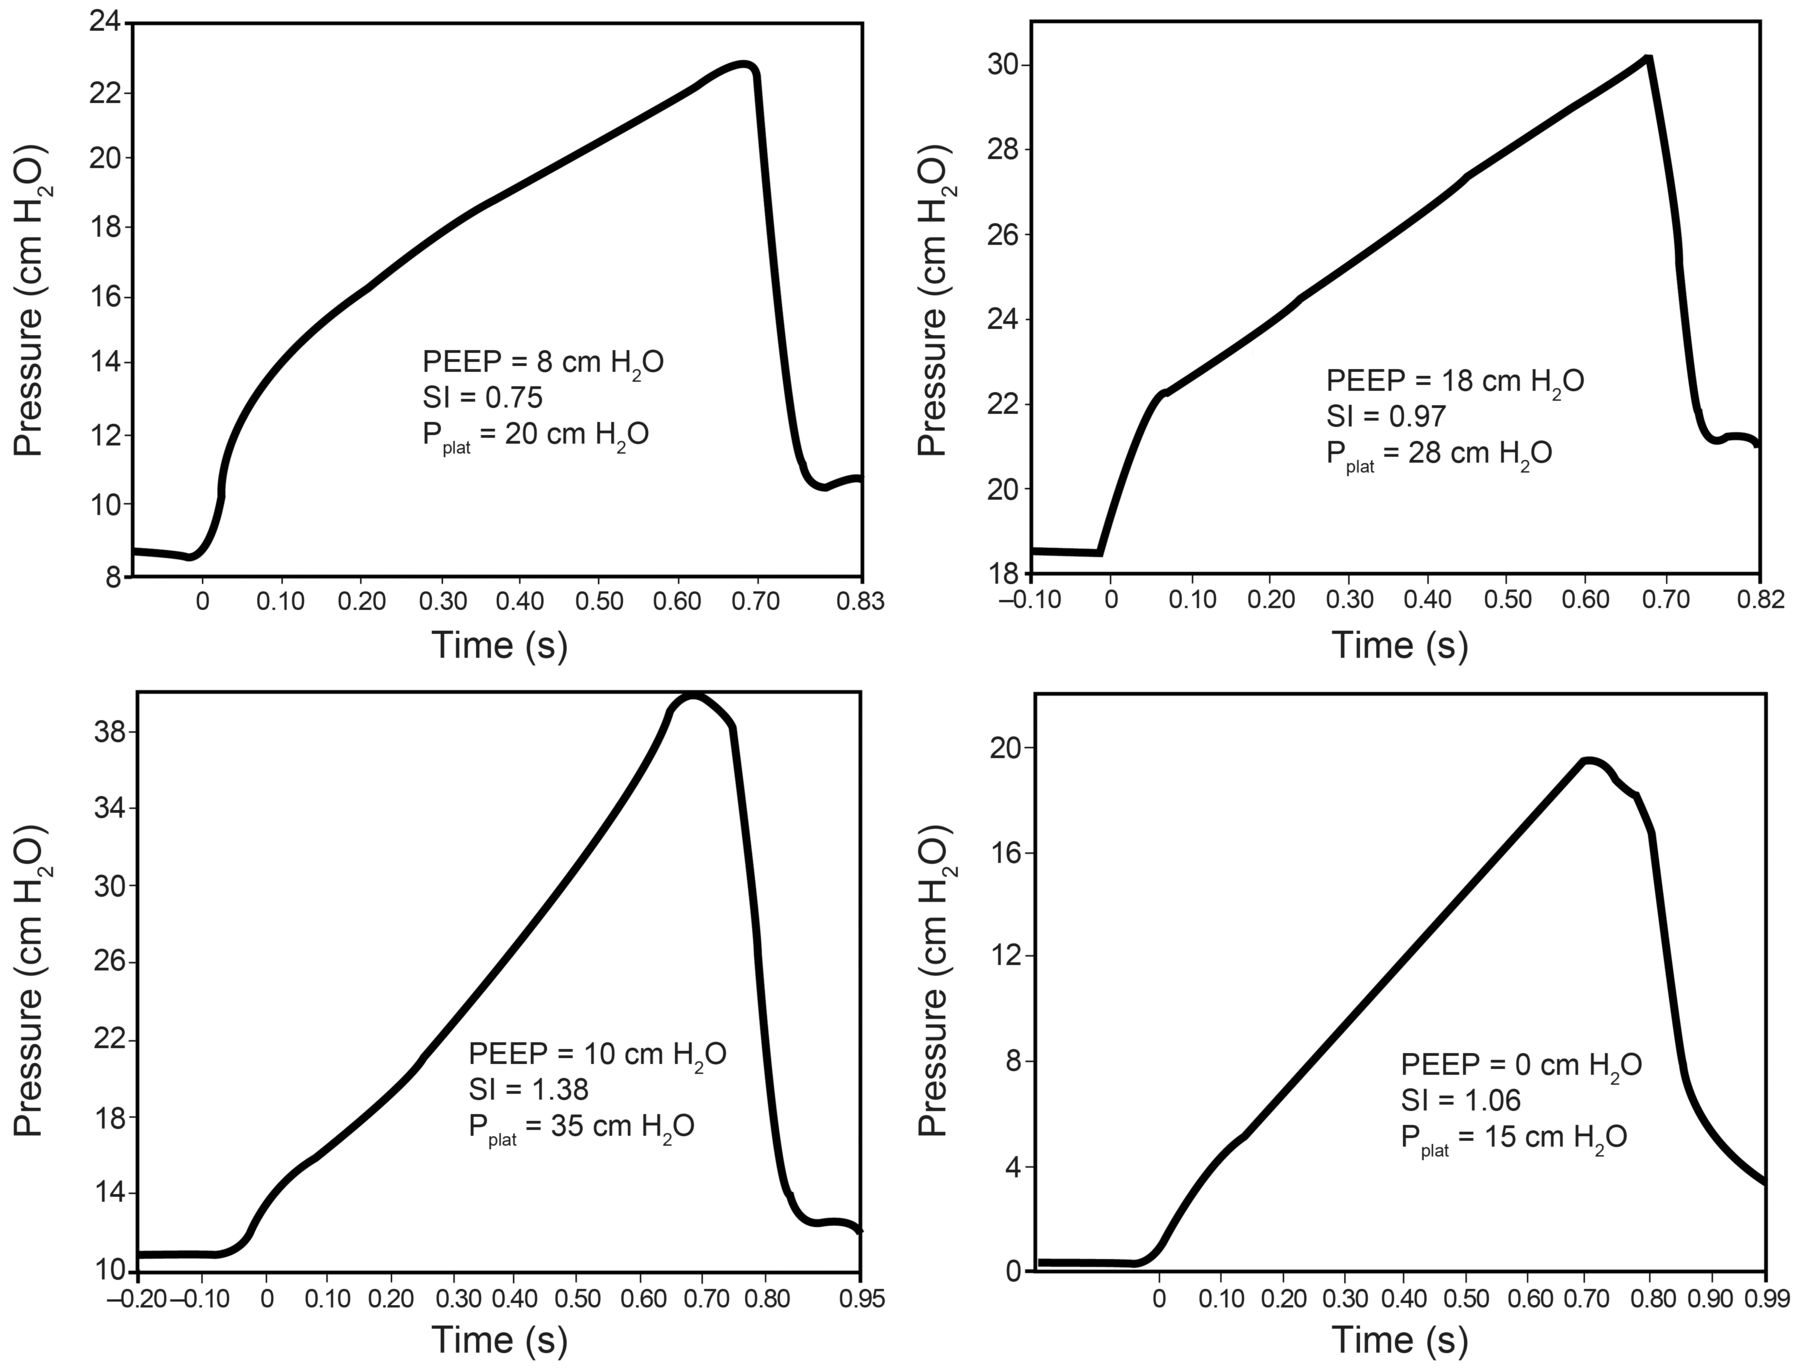
The stress index is the coefficient b of a power equation30: P = a × TIb + c, where the coefficient b (stress index) describes the shape of the curve. Using this equation, the stress index can be determined by curve-fitting this equation during passive constant-flow inflation (Fig. 11). One manufacturer has the stress index equation incorporated into the software of the ventilator to allow display of the stress index. Alternatively, one can examine the shape of the airway pressure waveform displayed on the ventilator (Fig. 12). The results of a recent study using computed tomography to identify over-distention reported that injurious ventilation was associated with a Pplatof > 25 cm H2O and a stress index of > 1.05.6
Fig. 11.
Top: Stress index (SI) in a patient early in the course of ARDS. In this case, the stress index improved as PEEP was increased. Bottom: Stress index in a patient late in the course of ARDS. In this case, the stress index improved as PEEP was decreased. Pplat = plateau pressure. From Reference 31.
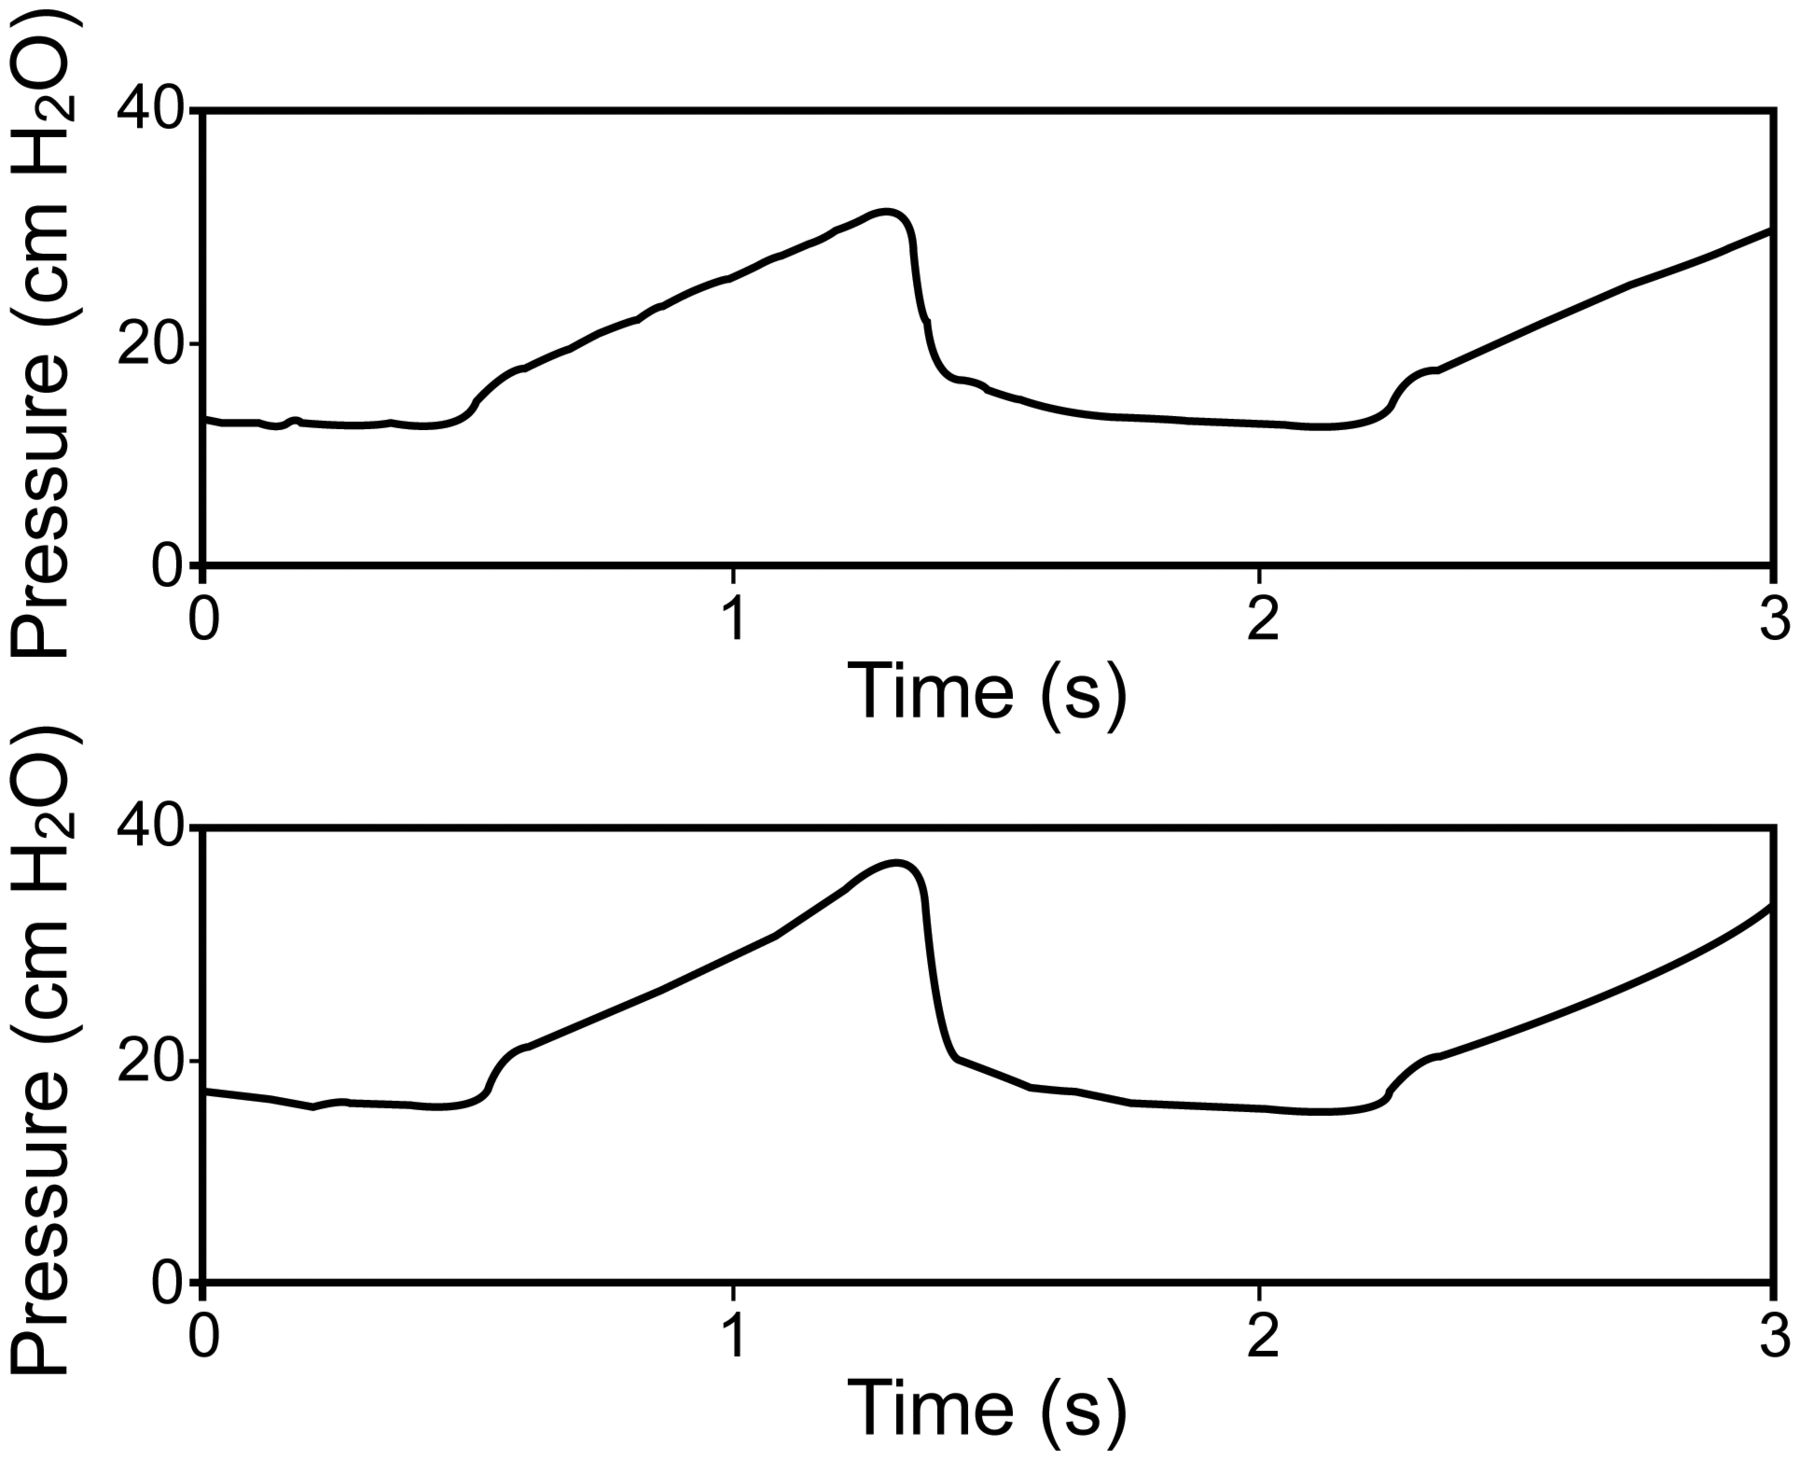
Fig. 12.
Top: Ventilator pressure waveform with a PEEP of 12 cm H2O. Note the linear increase in pressure. Bottom: Ventilator pressure waveform after PEEP was increased to 15 cm H2O. Note the upward concavity in pressure.
Flow and Volume
Time Constant
An important principle for understanding pulmonary mechanics is that of the time constant. The time constant determines the rate of change in the volume of a lung unit that is passively inflated or deflated. It is expressed by the relationship: Vt = Vi × e−t/τ, where Vt is the volume of a lung unit at time t, Vi is the initial volume of the lung unit, e is the base of the natural logarithm, and τ is the time constant. For respiratory mechanics, τ is the product of resistance and compliance. Lung units with a higher resistance and/or compliance will have a longer time constant and require more time to fill and to empty. In contrast, lung units with a lower resistance and/or compliance will have a lower time constant and thus require less time to fill and to empty. There is a 63% volume change in 1 τ, an 87% volume change in 2 τ, a 95% volume change in 3 τ, a 98% volume change in 4 τ, and >99% volume change in 5 τ.
A simple method to measure the τE is to divide the exhaled VT by the peak expiratory flow (V̇EXH) during passive positive-pressure ventilation32: τE = exhaled VT/V̇EXH. Although this is a useful index of the global τE, it treats the lungs as a single compartment and thus does not account for time constant heterogeneity in the lungs.
Inspiratory Flow
All current-generation critical care ventilators monitor flow. Although some monitor flow with a pneumotachometer directly at the proximal airway, most monitor V̇I at the inspiratory valve and V̇E at the expiratory valve.3
During volume control ventilation, the V̇I is that which is set on the ventilator. During passive pressure control ventilation, flow is the pressure applied to the airway, Raw, and τ (Fig. 13): V̇I = (ΔP/Raw) × e−t/τ, where ΔP is the pressure applied to the airway above PEEP, t is the elapsed time after initiation of the inspiratory phase, and e is the base of the natural logarithm.
Fig. 13.
Flow shapes at different mechanical loads during pressure control ventilation. Top: Resistance variations. Bottom: Compliance variations. From Reference 4.
Expiratory Flow
Expiratory flow is normally passive and is determined by Palv, Raw, the elapsed time since initiation of exhalation, and τ: V̇ = −(Palv/Raw) × e−t/τ. Note that, by convention, expiratory flow is negative, and inspiratory flow is positive.
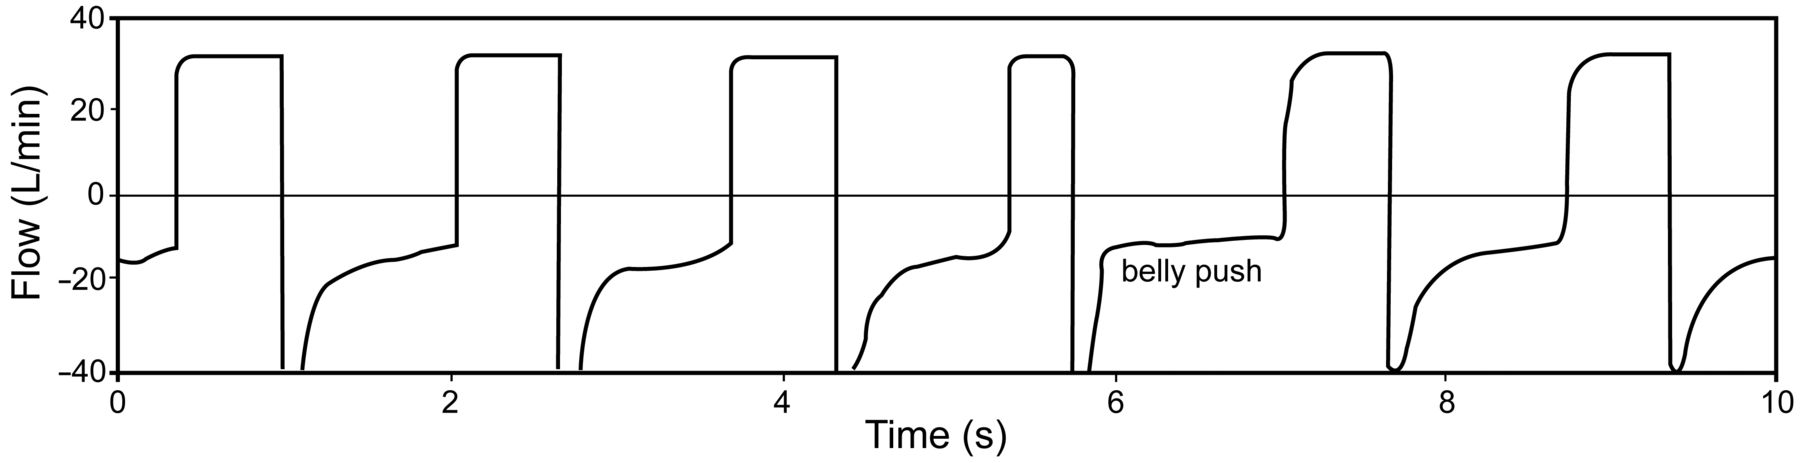
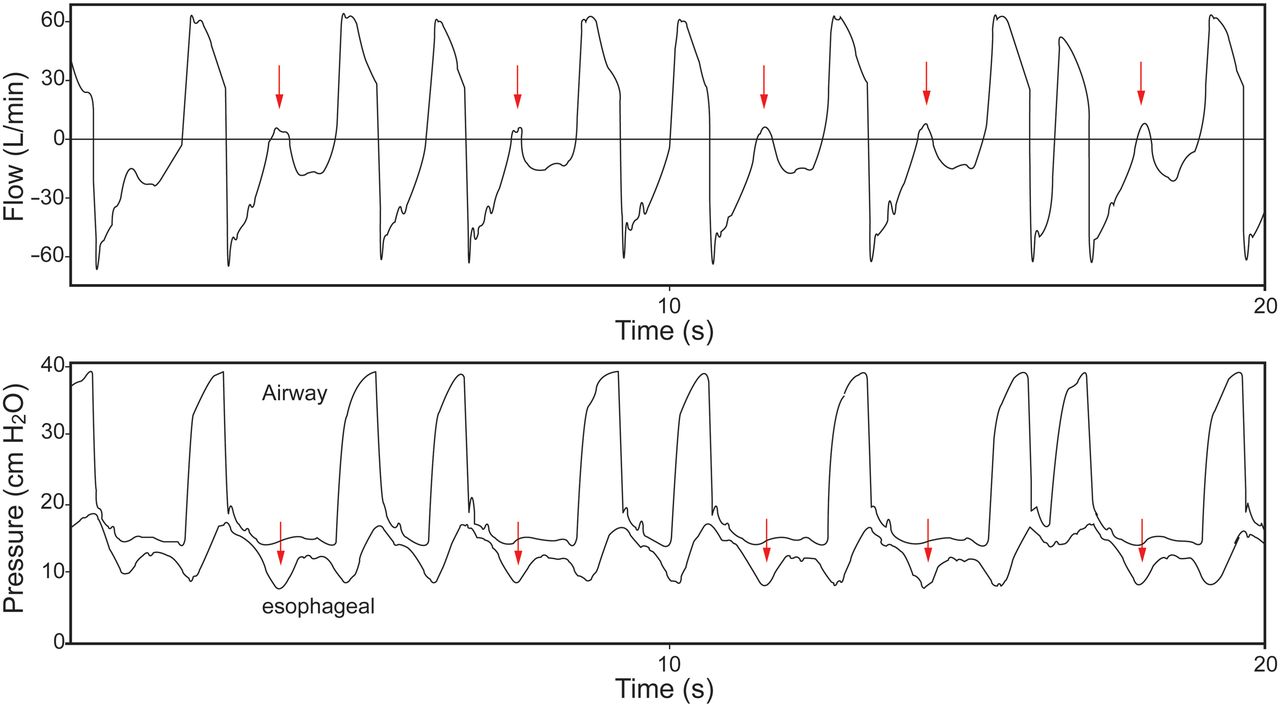
End-expiratory flow is present if Raw is high and TE is not sufficient, indicating the presence of air trapping (auto-PEEP). It may be of value to determine whether auto-PEEP is due to flow limitation. If pushing on the abdomen results in no additional expiratory flow, flow limitation is present (Fig. 14).33 The presence of missed triggers and flow limitation suggests that PEEP might effectively counterbalance auto-PEEP (Fig. 15). Notching in the expiratory flow waveform suggests the presence of missed trigger efforts (Fig. 16).
Fig. 14.
Effect of increased intra-abdominal pressure on expiratory flow in a patient with flow limitation. Note that there is no change in expiratory flow as intra-abdominal (and hence intrathoracic) pressure increases.
Fig. 15.
Effect of PEEP, auto-PEEP, and trigger effort in the setting of flow limitation.
Fig. 16.
Flow (top) and airway pressure and esophageal pressure (bottom) in a patient with severe COPD. The arrows represent missed triggers.
Tidal Volume
Critical care ventilators do not measure volume directly, but derive this from integration of flow. Because flow is usually not measured directly at the proximal airway, volume output from the ventilator is less than the volume delivered to the patient. Modern critical care ventilators correct volume for circuit compression, so the volume displayed by the ventilator closely approximates the volume delivered to the patient. The volume waveform may be useful to detect the presence of a leak (eg, bronchopleural fistula, leak around the cuff, leak around the mask), which results in a difference between the inspiratory and expiratory VT. Bolzan et al34 reported a method for managing endotracheal tube cuff inflation using volume-time graphics.
End-Expiratory Lung Volume
Calculation of end-expiratory lung volume is based on a step change in FIO2 and the assumption that N2 is the balance gas.35,36 Baseline determination is made of end-tidal N2 (FETN2). It is assumed that oxygen consumption and carbon dioxide production remain constant throughout the measurement. A step change in FIO2 then occurs, and the end-expiratory lung volume is calculated as: ΔVN2/ΔFETN2, where ΔFETN2 is the change following the step change in FIO2. The breath-to-breath changes are calculated over ∼20 breaths. The end-expiratory lung volume measurement is commercially available on the Engström Carestation (FRC INview, GE Healthcare, Madison, Wisconsin). For this application, nitrogen concentration in inhaled and exhaled gas is not directly measured, but estimated from the end-tidal concentrations of oxygen and carbon dioxide.
The use of end-expiratory lung volume during PEEP titration would seem attractive. However, a PEEP-induced increase in end-expiratory lung volume might be the result of recruitment, or it might be the result of over-distention of already open alveoli. Thus, end-expiratory lung volume by itself might not be useful to assess PEEP response.
Derived Measurements
Respiratory System Compliance
CRS is calculated as the VT divided by the pressure required: CRS = ΔV/ΔP = VT/(Pplat − PEEP), where ΔV is volume change. Acceptable CRS is 50–100 mL/cm H2O in mechanically ventilated patients. It is determined by the compliance of the lungs and chest wall.
CRS has been used to determine the optimal level of PEEP in patients with ARDS; the highest level of CRS corresponds to best PEEP. In 1975, Suter et al37 reported that the PEEP that resulted in the maximum oxygen delivery and the lowest dead-space fraction also resulted in the greatest CRS. The optimal PEEP ranged from 0 to 15 cm H2O. Mixed venous PO2 increased between 0 PEEP and the PEEP that resulted in maximum oxygen delivery, but then decreased at higher PEEP. The authors concluded that CRS could be used to determine the optimal PEEP.
The optimal PEEP is that which results in the lowest driving pressure (Pplat − PEEP) if VT is kept constant. Mercat et al38 used an approach in which PEEP was set as high as possible without increasing Pplat above 28–30 cm H2O. Using this approach, higher PEEP is likely set to best compliance because compliance increases with alveolar recruitment. With over-distention, compliance decreases, and Pplat is more likely to be > 30 cm H2O. This approach for setting PEEP did not significantly reduce mortality, but it did improve lung function and reduced the duration of mechanical ventilation and organ failure.
Pintado et al39 recently reported a randomized controlled study to evaluate the effect of setting an individualized PEEP at the highest CRS. Subjects in the CRS-guided group had a nonsignificant improvement in 28-d mortality (21% vs 39%, P = .12), perhaps because the study was underpowered. Multiple-organ dysfunction-free days (median of 6 vs 20.5 d, P = .02), respiratory failure-free days (median of 7.5 vs 14.5 d, P = .03), and hemodynamic failure-free days (median of 16 vs 22 d, P = .04) at 28 d were significantly lower in subjects with a CRS-guided setting of PEEP.
Chest-Wall Compliance
To calculate CCW, changes in Pes (Ppl) are used during passive inflation17: CCW = ΔV/ΔP = VT/ΔPes. The patient data in Figure 17 can be used to calculate CCW: CCW = 320 mL/4 cm H2O = 80 mL/cm H2O. Normal CCW is 200 mL/cm H2O and is decreased due to morbid obesity, abdominal compartment syndrome, chest-wall edema, chest-wall burns, and thoracic deformities (eg, kyphoscoliosis). CCW is also decreased with an increase in muscle tone (eg, a patient who is asynchronous with the ventilator). CCW is increased with flail chest and paralysis.
Fig. 17.
Flow, esophageal pressure, airway pressure, and transpulmonary pressure can be used to calculate respiratory system compliance, chest-wall compliance, lung compliance, inspiratory airway resistance, and expiratory airway resistance. See text for details. PIP = peak inspiratory pressure; Pplat = plateau pressure.
Lung Compliance
To calculate CL, the change in PL when the lungs are inflated is used: CL = ΔV/ΔP = VT/ΔPL. Normal CL is 200 mL/cm H2O. CL is decreased with ARDS, cardiogenic pulmonary edema, pneumothorax, consolidation, atelectasis, pulmonary fibrosis, pneumonectomy, bronchial intubation, and over-distention. CL is increased with emphysema.

The patient data in Figure 17 can be used to illustrate these calculations:(3)These calculations can be crosschecked in the following manner: 1/CRS = 1/CCW + 1/CL and 1/23 ≈ 1/80 + 1/32. In this example, CL and CCW are both decreased, but CL is the most compromised.
Airway Resistance
During volume control ventilation, RI can be estimated from the PIP, Pplat, and end-inspiratory flow: RI = (PIP − Pplat)/V̇I. RE can be estimated from the V̇EXH and the difference between Pplat and PEEP40: RE = (Pplat − PEEP)/V̇EXH. Common causes of increased Raw are bronchospasm, secretions, and a small inner diameter endotracheal tube. For intubated and mechanically ventilated patients, RI should be < 10 cm H2O/L/s. RE is typically greater than RI.


The patient data in Figure 17 can be used to illustrate these calculations:(4)(5)
Work of Breathing
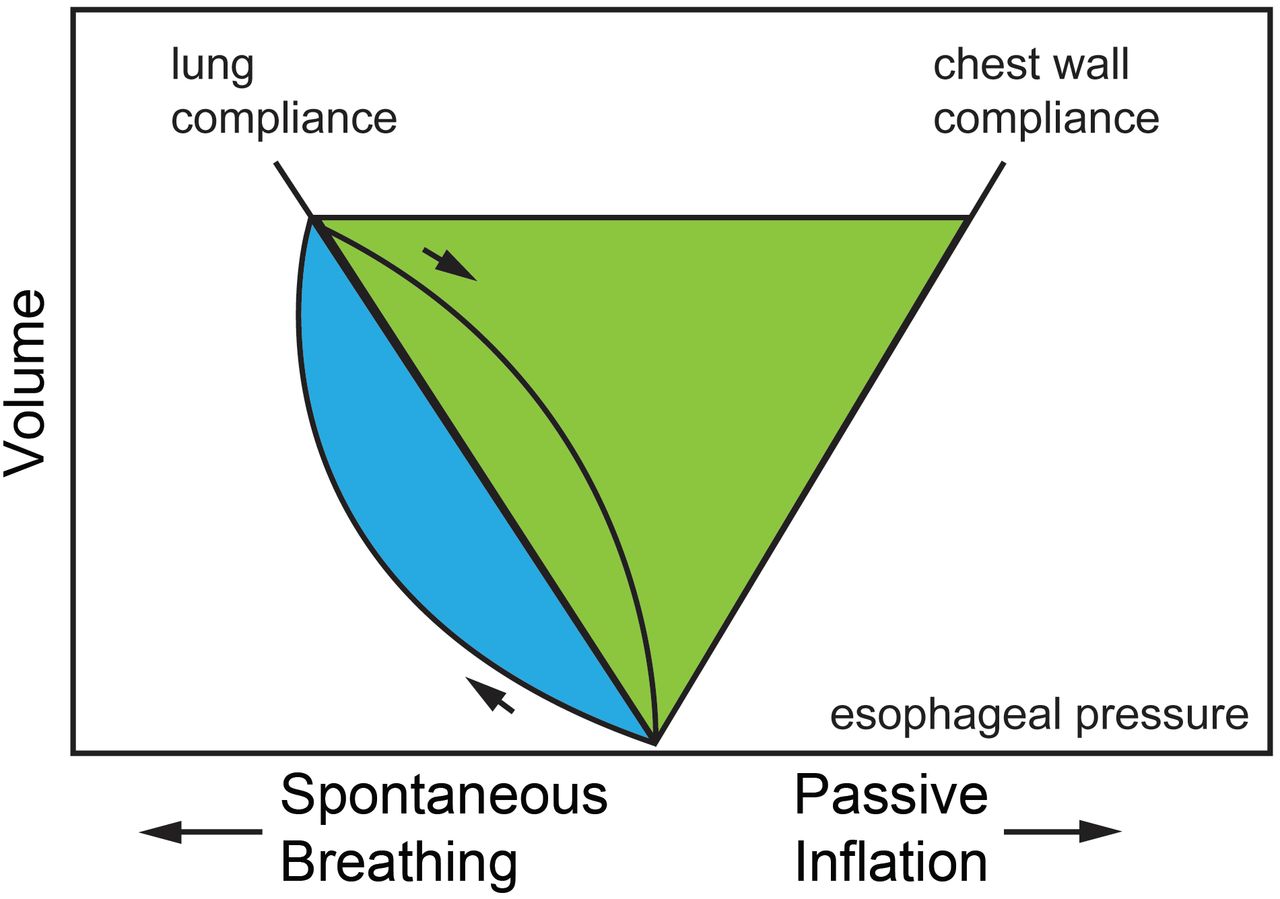
The Campbell diagram (Fig. 18) includes the effects of CCW, CL, and Raw on WOB.41 Note that WOB is increased with decreased CCW, decreased CL, or increased Raw. WOB requires an esophageal balloon to properly quantify, and for that reason, it is not frequently measured. It is not clear that measuring WOB improves patient outcome. Normal WOB is 0.3–0.7 J/L.
Fig. 18.
Campbell diagram as used to calculate work of breathing (WOB). The green area represents elastic WOB, and the blue area represents resistive WOB. The total shaded area represents total WOB.
The algorithm for proportional assist ventilation of the Puritan-Bennett 840 ventilator estimates compliance and resistance by performing a 300-ms inspiratory pause every 8–15 breaths. V̇I is measured and instantaneously integrated to volume. WOB is calculated from the measured V̇I and the P calculated from the equation of motion: WOB = ∫P × V. Power of breathing (WOB/min) is the rate at which work is done as a measure over time, not for an individual breath.42–46 This may be a better assessment of respiratory muscle load than WOB/breath. Normal power of breathing is 4–8 J/min. An artificial neural network can be used to estimate power of breathing noninvasively, without the need for an esophageal catheter in patients with respiratory failure.42 In one study, a WOB/min of < 10 J/min was predictive of subjects’ ability to be liberated from mechanical ventilation.43
Adaptive support ventilation (ASV) is based on the concept of minimum WOB, which suggests that the patient will breathe at a VT and breathing frequency that minimize the elastic and resistive loads while maintaining oxygenation and acid/base balance.35,47 This uses the approach described by Otis to determine the breathing frequency associated with the lowest WOB. Of note, Otis based his data on the patient, whereas adaptive support ventilation is based on the ventilator. The target breathing frequency is determined by respiratory mechanics and alveolar ventilation.
With ASV, the ventilator attempts to deliver 100 mL/min/kg of minute ventilation, adjustable from 25% to 350%, which allows the clinician to provide full support or encourage spontaneous breathing. VT is determined by dividing the target V̇E by the target rate. Note that a higher breathing frequency (and lower VT) will be targeted for low compliance (low τ), whereas a lower breathing frequency (and higher VT) will be targeted for a high resistance (high τ). This is observed clinically, where patients with pulmonary fibrosis breath rapidly and shallowly. For patients with COPD with a high τ, the WOB is less with a lower breathing frequency. For ASV, the ventilator also adjusts the inspiratory-expiratory ratio and TI of the mandatory breaths by calculation of the τE, as described above, to maintain sufficient TE (3 × τ). During spontaneous breathing, ASV controls only the pressure of pressure support breaths.
Pressure-Volume Curves
P-V curves are displayed with volume as a function of pressure.36,48 The slope of the P-V curve is CRS. The most common methods used to measure pressure-volume curves are the use of a super syringe, inflation with a constant slow flow (< 10 L/min), and Pplat at various inflation volumes. Correct interpretation of the P-V curve during non-constant-flow ventilation (eg, pressure control ventilation) and with higher V̇I is problematic. Several current-generation ventilators are able to measure P-V curves using a slow inflation technique at several levels of PEEP to assess alveolar recruitment and inflection points to determine the appropriate level of PEEP.
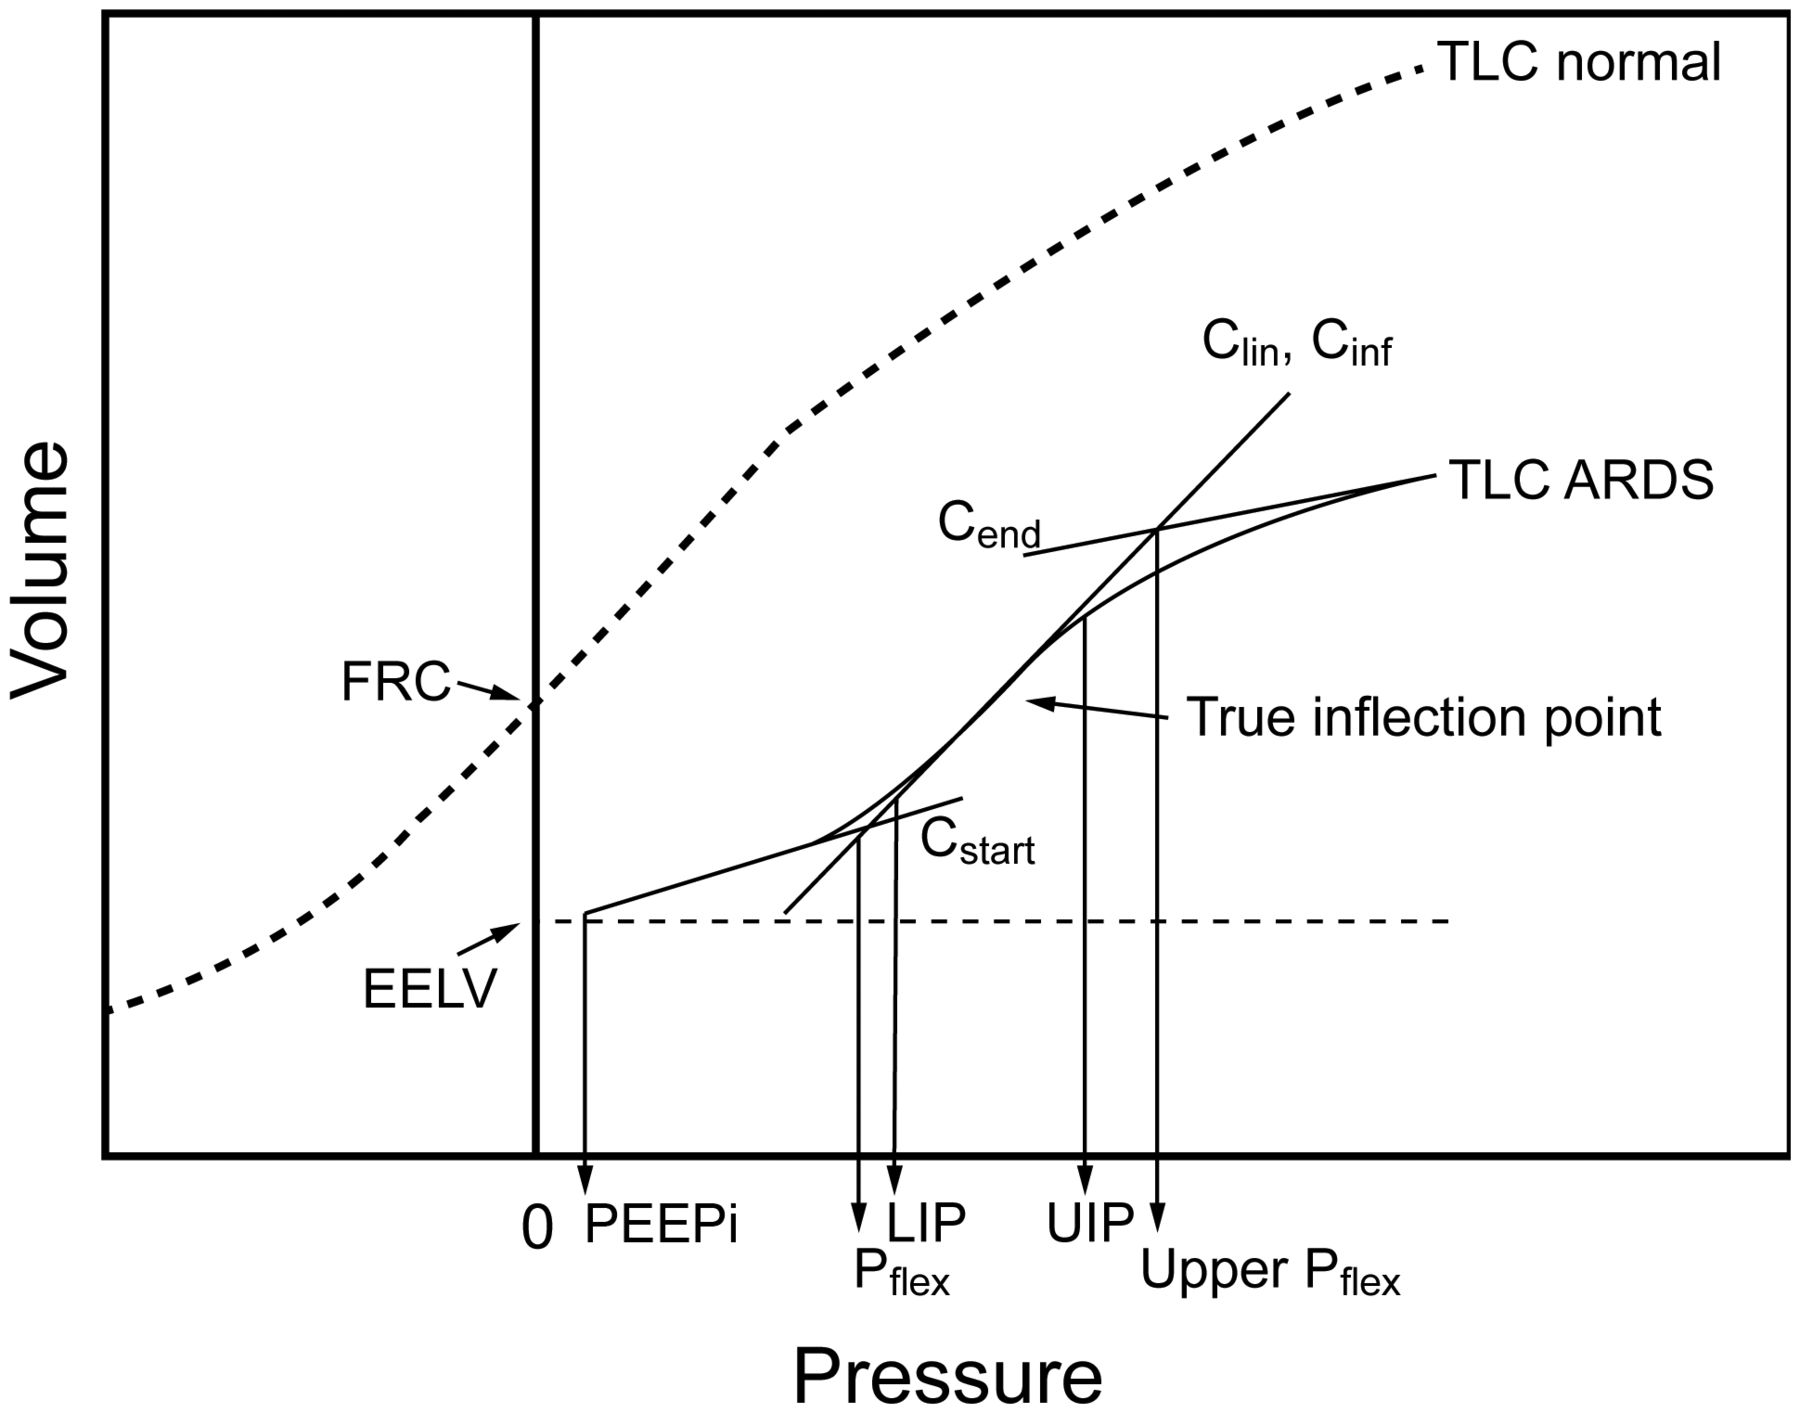
An approach for setting PEEP is based on inflection points determined from the P-V curve (Fig. 19).49,50 The lower inflection point is thought to represent the pressure at which a large number of alveoli are recruited, and the upper inflection point is thought to indicate over-distention. However, recruitment is likely to occur along the entire inflation P-V curve, and the upper inflection point might represent the end of recruitment rather than over-distention.
Fig. 19.
Pressure-volume curve of a normal subject (dashed curve) and of a patient with ARDS (solid curve). The pressure-volume curve is shifted downwards on the volume axis and has a reduced total lung capacity (TLC). The sigmoid shape of the curve is much more evident in ARDS. Note the small amount of pressure at the start of the ARDS pressure-volume curve, indicating a small amount of intrinsic PEEP (PEEPi) at end-expiratory lung volume (EELV). Some investigators divide the curve into linear segments: Cstart, Cinf or Clin, and Cend (explained below). Using these segments, the upper and lower Pflex (the pressure at the intersection of 2 lines: a low compliance region at low lung volumes [Cstart] and a higher compliance region at higher lung volumes [Cinf]) were defined by the intersection of these lines. The lower (LIP) and upper (UIP) inflection points are defined by where the curve first begins to deviate from the line Clin. Mathematically, these are not inflection points; the true inflection point (where concavity changes direction) is marked by the arrow. FRC = functional residual capacity. From Reference 47.
A number of issues preclude routine use of pressure-volume curves to set the ventilator in patients with ARDS.31,48,51,52 Measurement of the pressure-volume curve requires sedation, and often paralysis, to correctly make the measurement. Precise identification of inflection points may require mathematical curve-fitting. Although the inflation limb of the pressure-volume curve is most commonly measured, the deflation limb may be more useful for setting PEEP. Chest-wall mechanics potentially affect the shape of the P-V curve, necessitating Pes measurement to separate lung from chest-wall effects. As with most measures of respiratory mechanics, the P-V curve treats the lungs as a single compartment, disregarding the inhomogeneity of the lungs of patients with ARDS.
Performing P-V curves and measuring lung volume corresponding to different PEEP levels can be used to assess PEEP-induced lung recruitment.53,54 Lung recruitment at a given airway pressure is observed as the difference in lung volume between P-V curves starting at different lung volumes corresponding to different levels of PEEP (Fig. 20).
Fig. 20.
Pressure-volume (P-V) curve technique to determine recruited lung volume with 2 levels of PEEP.
Flow-Volume Loops
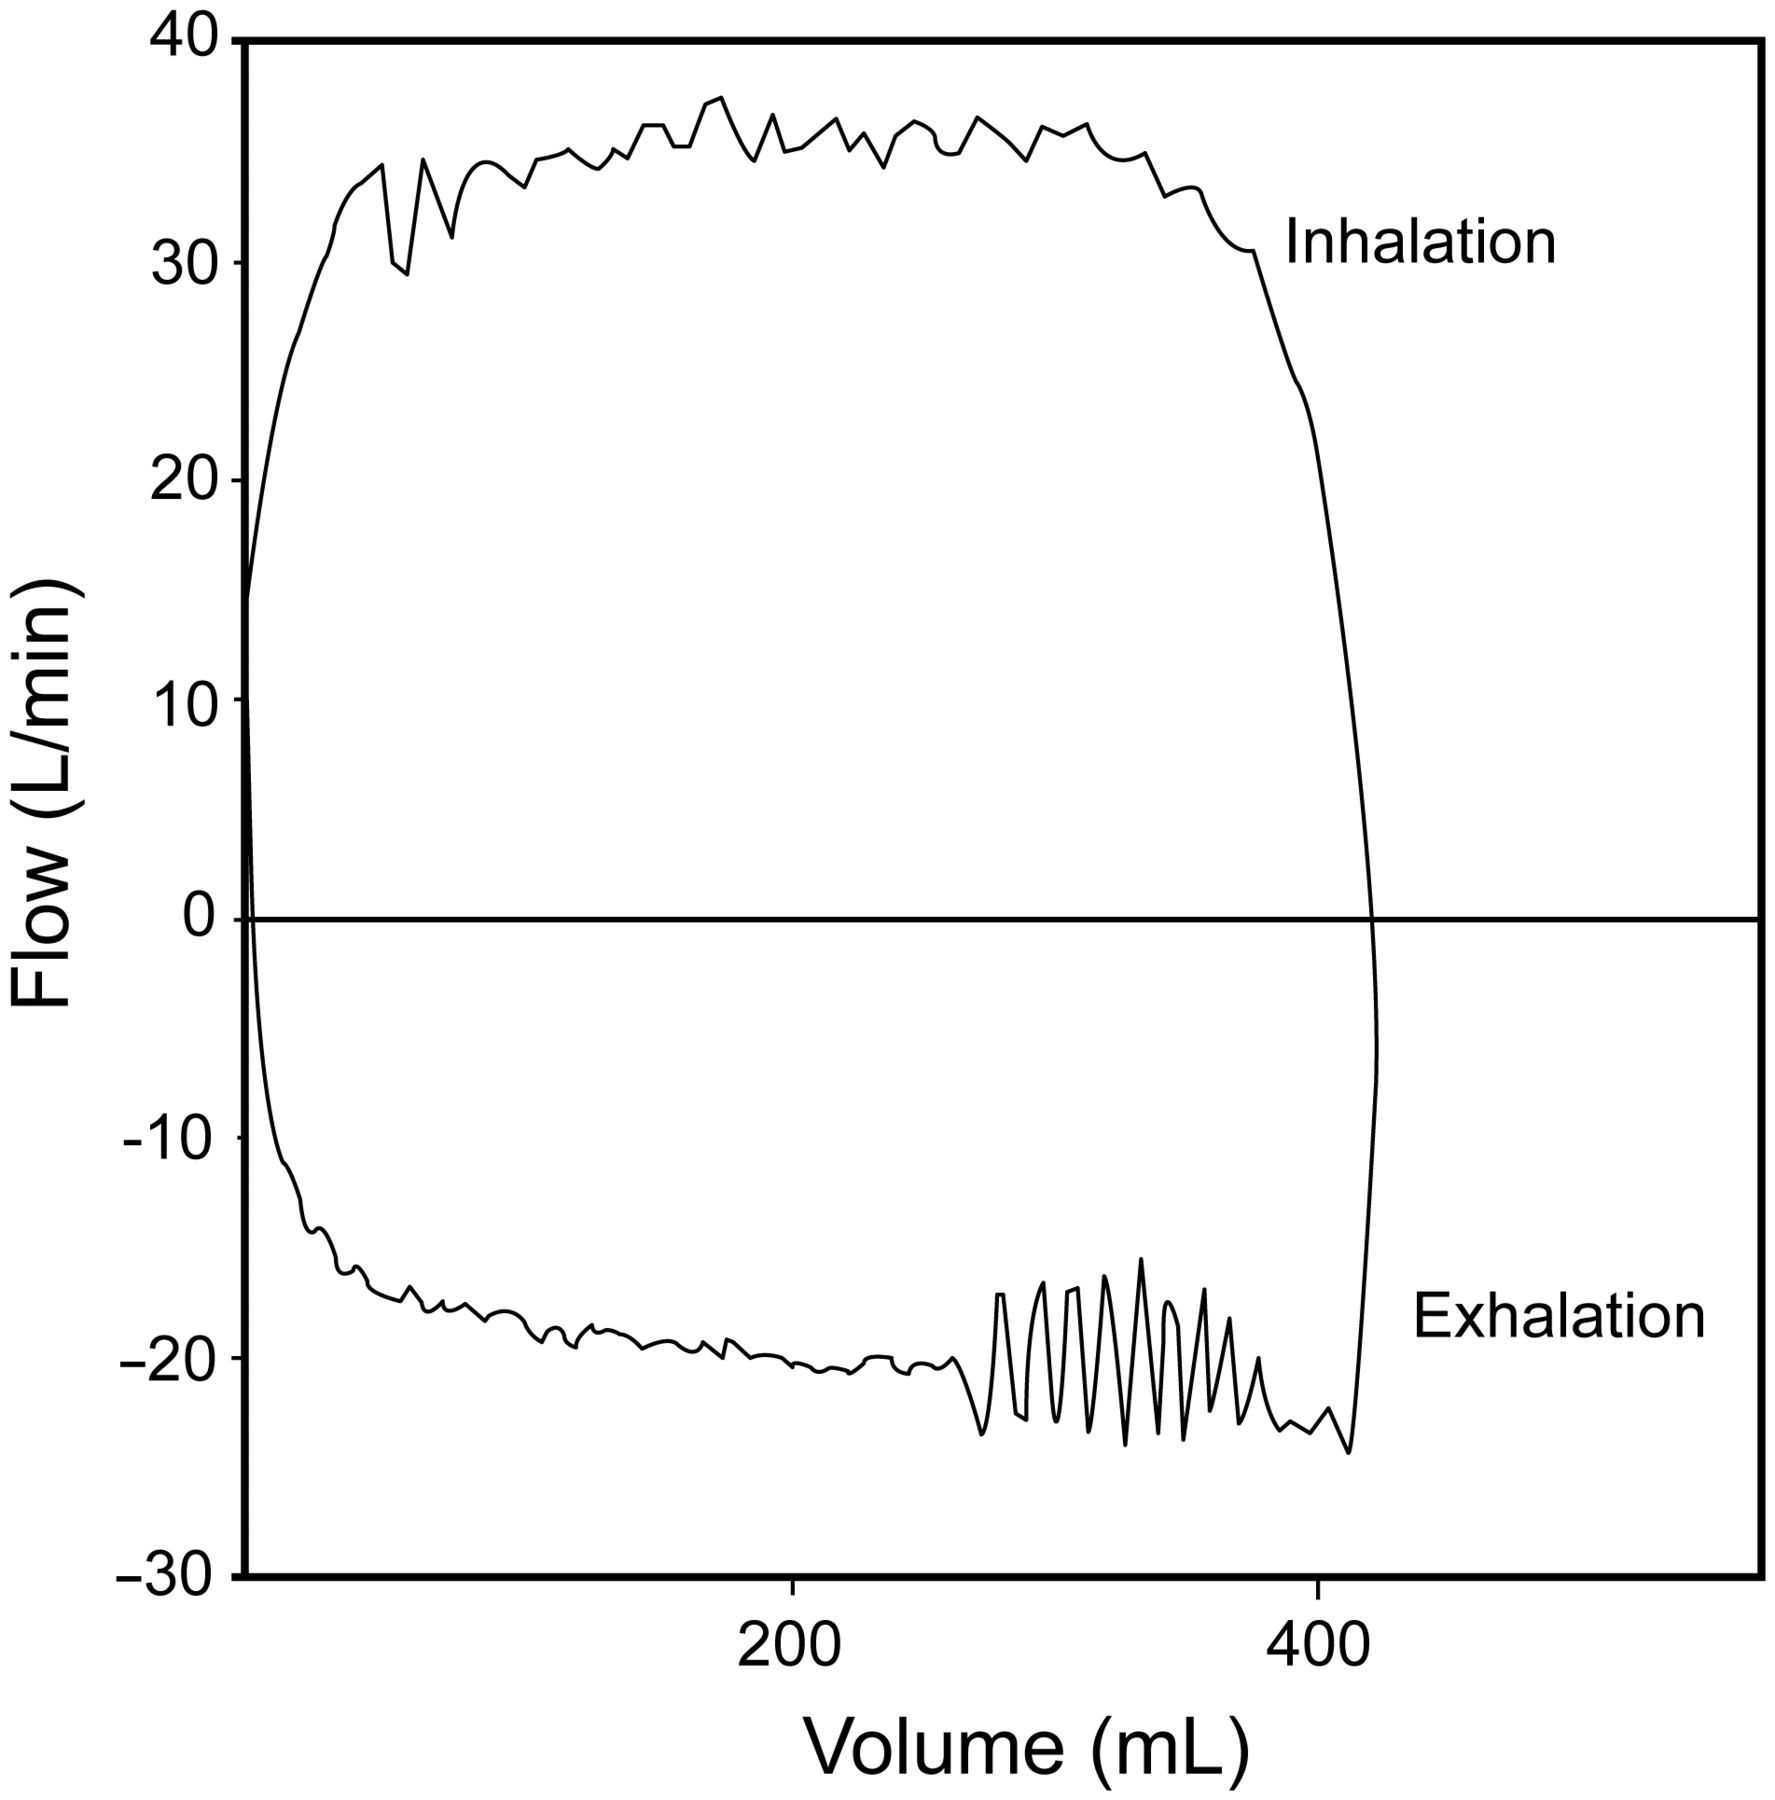
Flow-volume loops are displayed with flow as a function of volume. Some systems display expiratory flow in the positive direction, whereas other systems display expiratory flow in the negative direction. Analysis of the flow-volume loop may be helpful for identifying flow limitation during expiration, the presence of secretions in the airway (Fig. 21), and bronchodilator response (Fig. 22).55 The flow-volume curve can provide an indication of excessive secretions more reliably than clinical examination, with the presence of excessive secretions in the airways producing a sawtooth pattern on both the inspiratory and expiratory flow-volume curves.56
Fig. 21.
Sawtooth pattern on flow-volume curve representing secretions in the airway.
Fig. 22.
Flow-volume curve illustrating response to bronchodilation in a patient with obstructive lung disease.
Tension-Time Index and Pressure-Time Product
The tension-time index (TTI) has been used to predict diaphragmatic fatigue. It is calculated as: TTI = (Pdi/Pdimax)× (TI/Ttot), where Pdimax is Pdi with maximum inhalation.57 Pdi/Pdimax is the contractile force of the diaphragm, and TI/Ttot is the contraction duration (duty cycle).
A tension-time index of > 0.15 predicts respiratory muscle fatigue. Measurement of the Pdi requires esophageal and gastric pressure measurements, which are seldom performed in mechanically ventilated patients. A simpler form of the tension-time index is the pressure-time index (PTI),58which can be determined more readily with equipment available in the ICU. It is calculated as: PTI = (Pbreath/PImax) × (TI/Ttot), where Pbreath is the pressure required to generate a spontaneous breath, and PImax is the maximum pressure that can be generated against an occluded airway. The Pbreathcan be determined with esophageal balloon measurements during a short trial of spontaneous breathing.
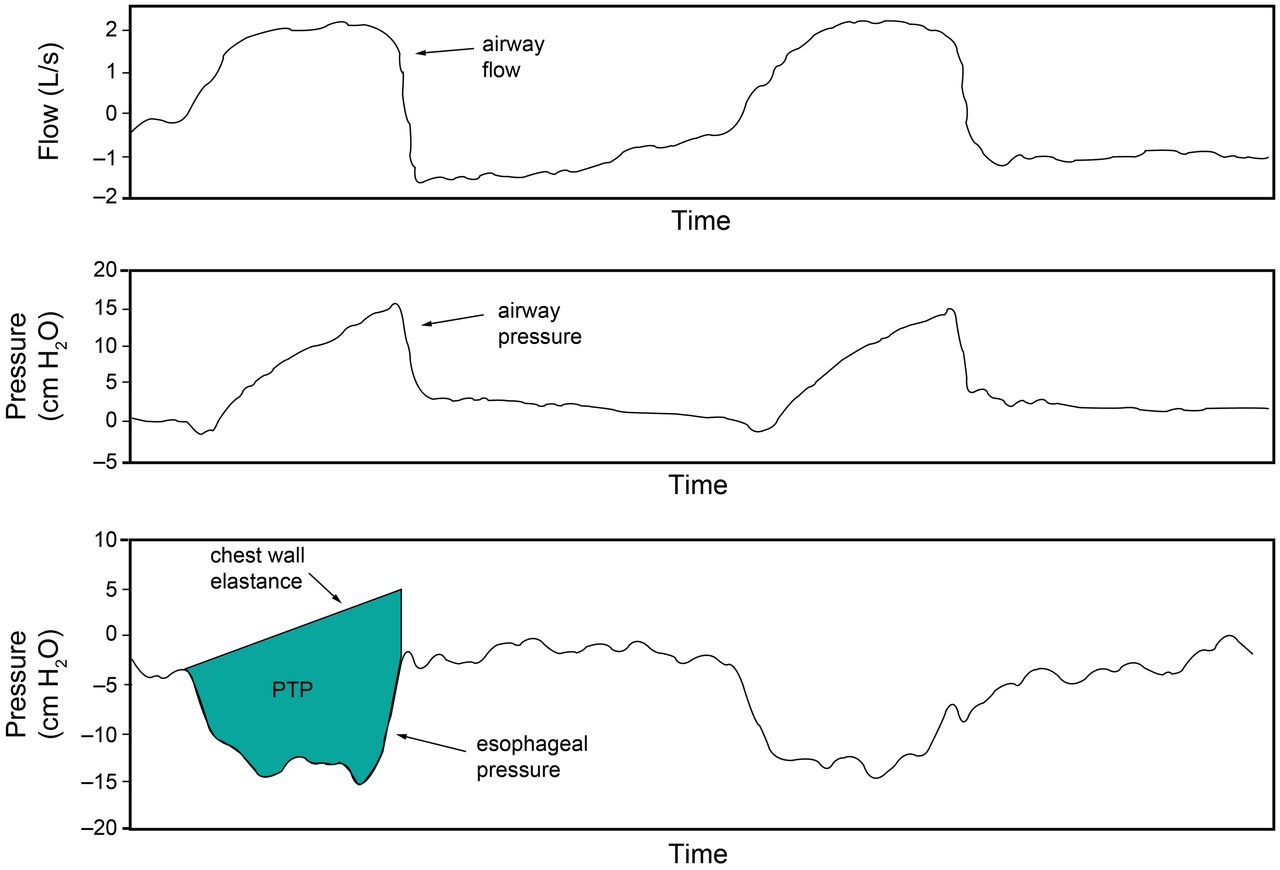
The pressure-time product (PTP) was developed to account for energy expenditures during the dynamic and isometric phases of respiration.59 WOB does not account for the isometric phase of respiration because there is no volume change. For example, energy is expended to overcome the threshold load of auto-PEEP, but technically this is not work because there is no volume moved into the lungs. Thus, different patients might have the same WOB, but the respiratory efficiency (WOB/oxygen consumption of respiratory muscles) could be quite different. The PTP is measured as the time integral of the difference between the Pes tracing and the recoil pressure of the chest wall (Fig. 23). The traditional measurement of PTP may fail to account for the energy needed for active expiration, which has led to the determination of upper bound PTP and lower bound PTP to enable calculations of PTP throughout the respiratory cycle so that total energy expenditure can be approximated.60
Fig. 23.
Illustration of the determination of pressure-time product (PTP). PTP is shown in the shaded area.
Esophageal Pressure for PEEP Titration
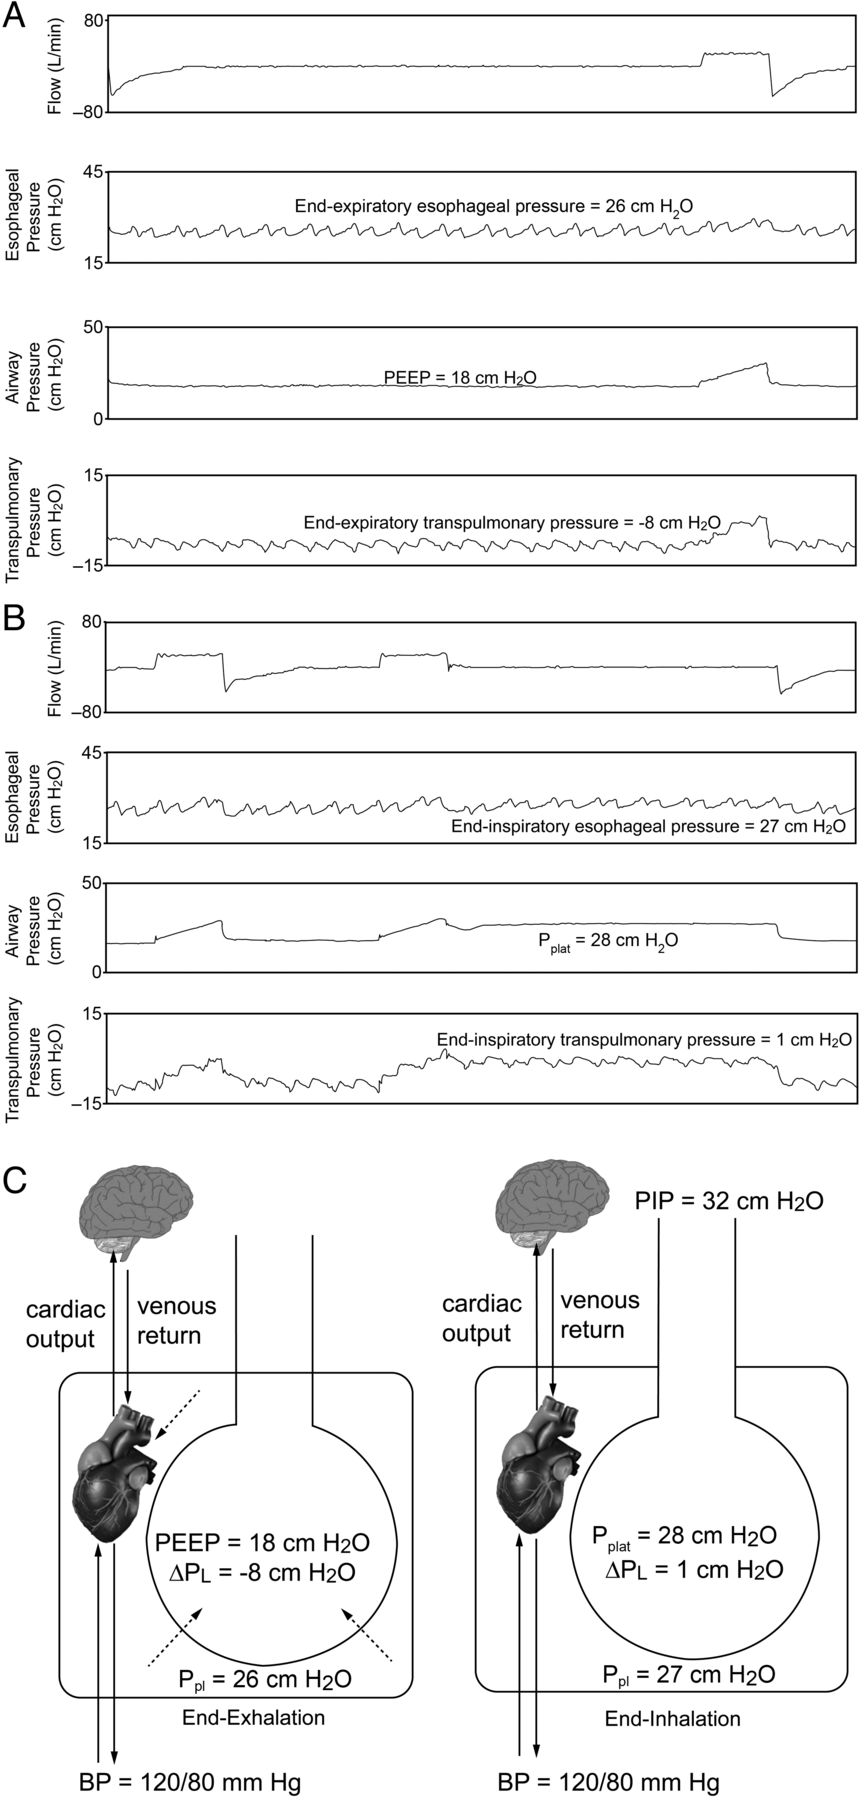
Particularly in patients with extrapulmonary ARDS,61 the CCW may be reduced. This can result in an increase in Ppl, and if Ppl is high relative to Palv, there may be potential for alveolar collapse. In that case, it is desirable to set PEEP greater than Ppl. The use of an esophageal balloon to assess intra-Ppl has been advocated to allow a more precise setting of PEEP (Figs. 24 and 25).
Fig. 24.
Esophageal pressure, airway pressure, and transpulmonary pressure (PL) with PEEP set at 18 cm H2O. A: During expiratory pause. B: During inspiratory pause. C: As shown in the cartoon, there is a net collapsing pressure on the lungs, heart, and central circulation at the end of exhalation. At the mid-thoracic level (position of the esophageal balloon), the end-inspiratory PL is slightly positive. Pplat = plateau pressure; PIP = peak inspiratory pressure; Ppl = pleural pressure; BP = blood pressure.
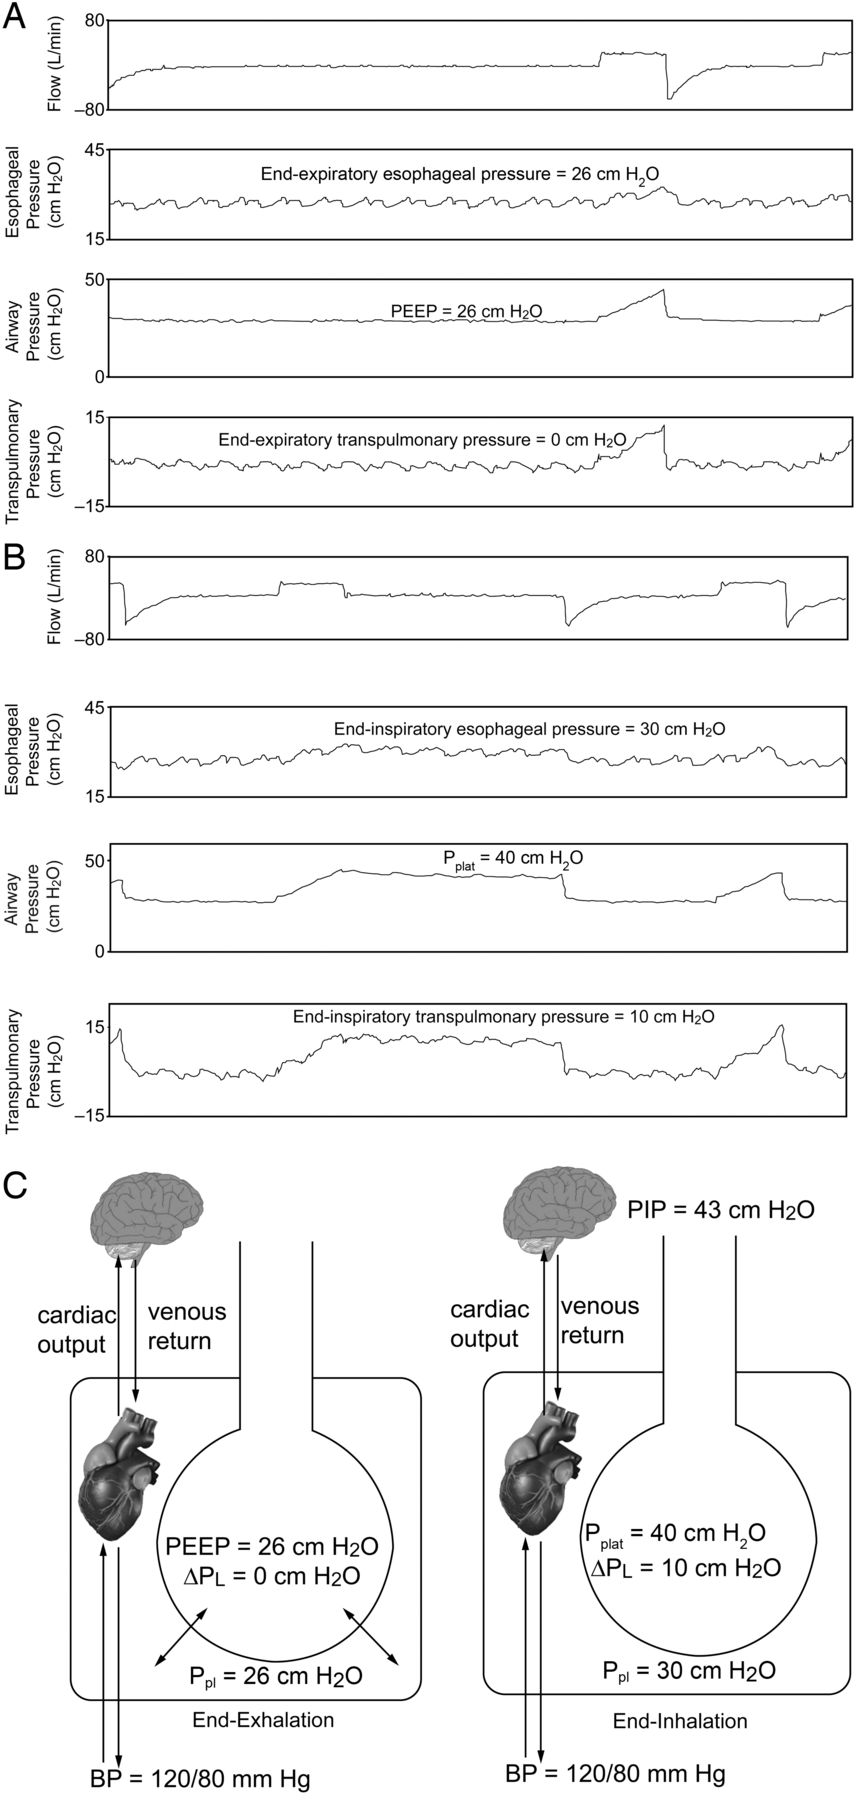
Fig. 25.
Esophageal pressure, airway pressure, and transpulmonary pressure (PL) with PEEP set at 26 cm H2O (same patient as Fig. 24). A: During expiratory pause. B: During inspiratory pause. C: as shown in the cartoon, the PEEP counterbalancs the Pes (pleural pressure [Ppl]). Note that the same pressure is exerted on the heart and central circulation at the end of exhalation. At the mid-thoracic level (position of the esophageal balloon), the end-inspiratory PL is 10 cm H2O, which is likely safe, despite a plateau pressure (Pplat) of 40 cm H2O. Note that blood pressure (BP) is not affected because there is no increase in Ppl with the addition of PEEP. PIP = peak inspiratory pressure; Ppl = pleural pressure; BP = blood pressure.
Talmor et al14 randomly assigned subjects with ARDS to PEEP adjusted according to measurements of Pes or according to the ARDS Network low PEEP table.5 Compared with the PEEP table, the ventilatory strategy using Pes to estimate the PL resulted in significantly greater oxygenation and compliance. There are several criticisms of this study. First, the primary end point was an improvement in oxygenation rather than a patient-important outcome like mortality. Second, the low PEEP table of the ARDS Network is likely not sufficient in patients with moderate and severe ARDS. A multi-center trial is now underway using a more aggressive approach to PEEP in the control group (high PEEP table of the ARDS Network)62 and with a composite outcome of mortality and time off the ventilator at 28 d (ClinicalTrials.gov registration NCT01681225). Whether or not esophageal manometry proves useful for routine setting of PEEP, it is likely beneficial in selected patients, such as those with morbid obesity or abdominal compartment syndrome.
Stress and Strain
Stress is a force applied to an area, such as pressure applied to the lung parenchyma. Force applied at an angle generates shear stress. Strain is the physical deformation or change in shape of a structure, such as an alveolus, usually caused by stress. Elasticity is the reversible deformability of the alveolus generated by a stress, but allows the alveolus to return to its original shape. A stress that stretches the lungs may not seem to permanently change the size or shape of the lung, but it may affect lung integrity. The lungs are elastic structures that respond in an elastic manner to stress and strain.
Pes can be used to assess stress and strain.63,64 The clinical equivalent of stress is PL, and the clinical equivalent of strain is the ratio of ΔV to the functional residual capacity (FRC): PL (stress) = specific lung elastance × ΔV/FRC (strain), where ΔV is the change in lung volume above resting FRC with the addition of PEEP and VT. Specific lung elastance is constant at 13.5 cm H2O. A harmful threshold of strain is > 2. Thus, the harmful threshold of stress (PL) is 27 cm H2O. The recommended Pplat below 30 cm H2O is therefore reasonable for most patients with ARDS. However, a higher Pplat may be safe when PL is reduced due to an increase in Ppl. This makes a case for measurement of Pes in a patient with a stiff chest wall.
It is also possible to measure strain and then calculate stress if the end-expiratory lung volume is measured as FRC. However, strain is the lung volume above resting FRC without PEEP. Thus, end-expiratory lung volume is measured without PEEP to determine strain, which might not be safe, particularly in patients with severe ARDS.
This concept is illustrated in Figure 25. When the PEEP is set at 26 cm H2O, the end-inspiratory PL(stress) is 10 cm H2O, and strain is 0.74. In this case, stress at 10 cm H2O and strain at 0.74 are both safe, despite a Pplat of 40 cm H2O.
Stress will be concentrated in the setting of inhomogeneity within the lungs where regions of collapse border regions of ventilation. This is called a stress raiser64 and was first described many years ago by Mead et al.65 They considered 2 adjacent lung regions fully expanded at a PL of 30 cm H2O. If one of the 2 regions loses elasticity (ie, consolidation or collapse), the applied force concentrates in the other, thereby increasing its strain and stress. Mead et al65 calculated that, if the volume ratio of the 2 regions goes from 10/10 (both regions distended) to 10/1 (one region distended and the other collapsed/consolidated), the stress of the open regions increases from 30 to 130 cm H2O. The mathematical basis of this computation relies on the fact that the stress is a force/area ratio. A volume ratio of 10/1 should be transformed into a ratio of areas. As area is volume to a power of 0.66, a volume ratio of 10/1 is equal to an area ratio of (10/1)0.66, which is 4.57. Therefore, the initial force applied to the 2 lung regions should be multiplied almost 5-fold, thus increasing the stress of the open unit to 30 × 4.57 cm H2O = 137 cm H2O. The basic concept is that in an inhomogeneous lung, which is usually the case in mechanically ventilated patients, the presence of these areas of stress raisers might create dangerous regional PL despite an acceptable Pplat and PL. This effect can be minimized clinically by using the lowest Pplat possible for an individual patient.
Spontaneous Breathing and Pressure-Targeted Ventilation
Many years ago, Dreyfuss and Saumon66 conducted some interesting studies related to ventilator-induced lung injury. They subjected rats to low or high VT ventilation, using identical airway pressure (45 cm H2O) in both groups. Low VT with high airway pressure was produced by thoracoabdominal strapping during positive airway pressure ventilation. The rats subjected to high VT and high airway pressure ventilation quickly developed ventilator-induced lung injury. However, the animals that underwent thoracoabdominal strapping and were ventilated with high airway pressure but a normal VT did not develop ventilator-induced lung injury. The lungs of the animals with decreased CCW were presumably subjected to less stress. Another group of rats received negative-pressure ventilation with high VT, and these animals developed ventilator-induced lung injury.
More recently, Yoshida et al67 evaluated spontaneous breathing and muscle paralysis in 2 different severities of experimental lung injury. They found that in rabbits with mild lung injury, spontaneous breathing was beneficial to lung recruitment. However, in animals with severe lung injury, spontaneous breathing worsened lung injury, suggesting that muscle paralysis might be more protective for injured lungs by preventing injuriously high PL. In another experimental study, Yoshida et al68 found that spontaneous breathing caused pendelluft during early inflation, which was associated with more negative local Ppl in dependent lung regions versus non-dependent regions. This occurred despite limitation of VT to < 6 mL/kg. Comparable inflation of dependent lung during paralysis required almost 3-fold greater driving pressure (and VT) versus spontaneous breathing. These data suggest that spontaneous breathing might be harmful in the setting of moderate-to-severe lung injury. Indeed, several case reports have described barotrauma in spontaneously breathing patients receiving pressure support ventilation or airway pressure release ventilation.69,70
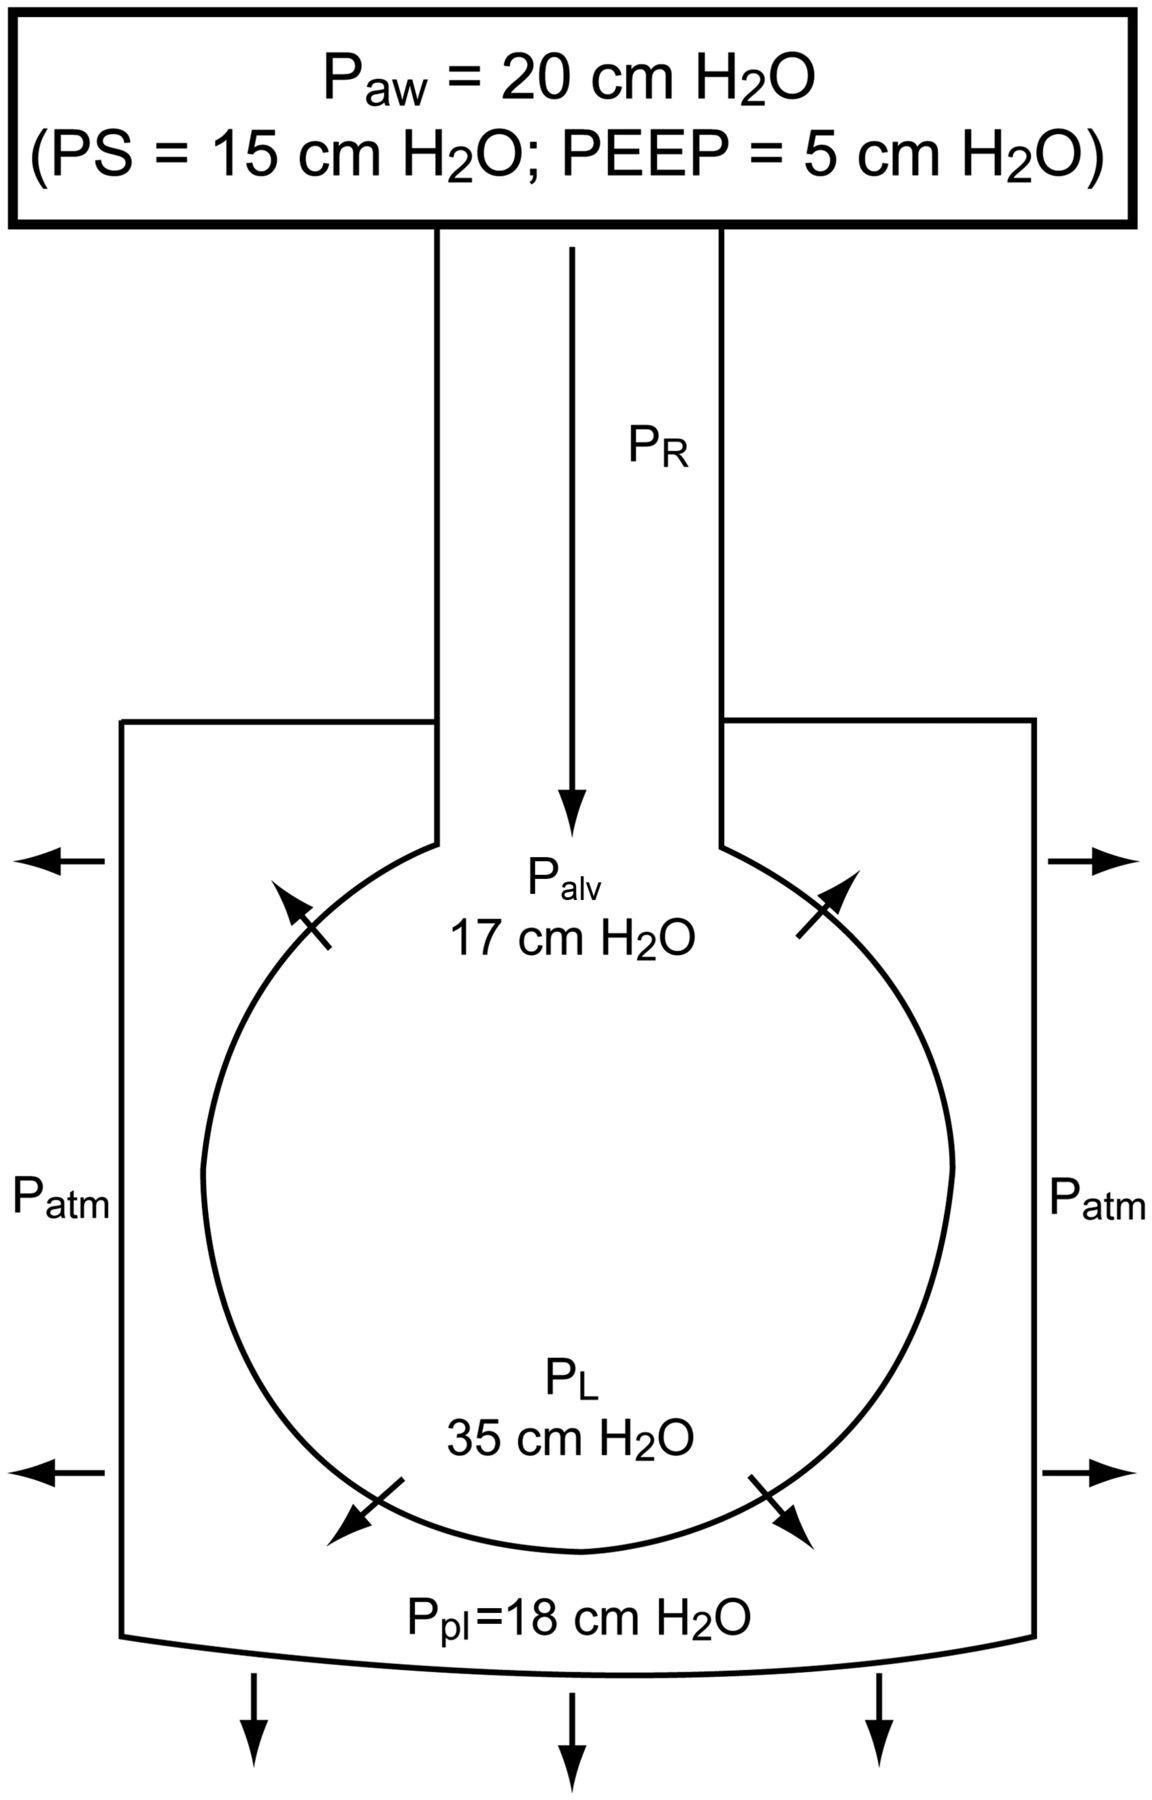
The potential benefits of pressure-targeted modes are better enhanced patient-ventilator interaction, the possibility of less sedation, improved ability to participate in care such as mobilization and ambulation, and better ventilation of dorsal lung units with subsequently improved alveolar recruitment and arterial oxygenation. However, these possible benefits must be weighed against the potential for alveolar over-distention with spontaneous breathing efforts. Imagine a patient who is being ventilated with a pressure-targeted mode such as pressure control, pressure support, or airway pressure release ventilation. The ventilator will provide flow to maintain constant airway pressure, and the spontaneous breathing efforts of the patient will lower the Ppl, thus increasing PL. As illustrated in Figures 26 and 27, a potentially injurious PL can occur using an airway pressure that might otherwise be considered safe.
Fig. 26.
Cartoon illustrating how a strong inspiratory effort can result in a high transpulmonary pressure (PL). Paw = airway pressure; PS = pressure support; PR = pressure drop due to airway resistance; Palv = alveolar pressure; Patm = atmospheric pressure; Ppl = pleural pressure.
Fig. 27.
Airway pressure, esophageal pressure, and transpulmonary pressure (PL) for a patient on pressure support ventilation (PSV). Note the high PL due to the patient’s strong inspiratory effort.
Respiratory variation in central venous pressure, which is commonly available in mechanically ventilated patients, can provide information about Ppl changes during the respiratory cycle. Large negative-pressure swings in central venous pressure during spontaneous breathing suggest a high PL. Perhaps most important, and easiest to monitor at the bedside, is the VT that results from the patient’s inspiratory effort. If the VT is not excessive, in most cases, the PL will be acceptable. However, due to the inhomogeneity of the disease process, a high PL might result in regional over-distention despite an acceptable VT. Regardless of the ventilator mode, in critically ill patients, the VT target should be 6 mL/kg of ideal body weight.
Pleural Pressure and Hemodynamics During Mechanical Ventilation
A common clinical question relates to the effect of positive-pressure ventilation on Ppl. Ppl is independent of CL17: Ppl = lung volume/CCW. Thus, it is not correct to refer to the amount of pressure transmitted to the pleural space because Ppl is determined by lung volume (VT and PEEP) and CCW. Ppl as a fraction of Palv is determined by the relationship: ΔPpl/ΔPalv = CL/(CL + CCW), or ΔPpl/ΔPalv = CRS/CCW. Under normal conditions, where CL and CCW are equal, ΔPpl will be half of ΔPalv. When CCW is reduced relative to CL, ΔPpl will be a greater fraction of ΔPalv. On the other hand, when CL is reduced relative to CCW, ΔPpl will be a lower fraction of ΔPalv.
Ppl affects hemodynamics due to its effect on the heart and central circulation. When Ppl is increased due to a decreased CCW, use of PEEP that counterbalances the collapsing effect of the chest wall should not compromise hemodynamics until the PEEP exceeds the Ppl due to chest-wall effects. Sarge et al71 reported that in subjects with ARDS, individualizing PEEP to optimize PL using esophageal manometry does not compromise hemodynamic function.
Summary
A variety of respiratory mechanics can be assessed in mechanically ventilated patients. This can be useful as a probe of the underlying pathophysiology. Assessment of respiratory mechanics can also be used to set the ventilator to minimize lung injury.


