
Introduction
The use of non-invasive mechanical ventilation (NIMV) at home as treatment for patients with chronic respiratory failure was initiated in Spain at the beginning of the nineties.1 The main pathologies in which this therapy has been applied have been neuromuscular and ribcage diseases,2 obesity-associated hypoventilation syndrome3 and chronic obstructive pulmonary disease (COPD).4 The proportion of patients affected by each of these diseases among those treated with home mechanical ventilation, however, is different in several European countries in the latest published study that compiles the patterns of home NIMV use in Europe, which was published in 2005 with data from the two previous years. Thus, while in some countries, such as Italy, the proportion of ventilated patients with airway pathologies (mainly COPD) reaches 50% of the total, in others, such as Spain, this does not surpass 20%.5 The increased use of non-invasive ventilation in clinical pulmonology observed in this last decade, however, may have substantially modified these territorial patterns of prescription.
In recent years, coinciding with the technical improvements that different respirators have been incorporating, there has been increased interest in understanding the consequences of patient–ventilator interaction on lung mechanics, and more specifically the effects of different ventilator modes and ventilation parameters that are modifiable by clinicians on these same mechanics. Therefore, several companies that manufacture ventilators have incorporated in their products the possibility to monitor ventilation on-line and to download the data stored in the internal memory. Along these lines, a recent publication6 recommends the use of monitoring systems for patients who receive home NIMV, especially in those in whom respiratory failure is not sufficiently corrected. It also identifies the need to validate the built-in software developed and introduced by manufacturers that provide the possibility to download the data stored in the internal memory of the ventilator. Nevertheless, the literature about the reliability of these software programs is limited. There is only one very recent study done in a simulation setting that explores the reliability of the leak and tidal volume calculations.7
The objective of this present study is to develop a critical and argumentative analysis of the technical characteristics of monitored variable determinations used in the different software programs incorporated in commercial ventilators, as well as the forms of presentation of these measurements on the screen, emphasizing the defects and the virtues of each one. The data presented here have been obtained by acquiring tracings, with actual patients, in a controlled simulation setting (Simulator IngMar Medical 2000 SL, Pittsburgh, PA, USA and PowerLab/16SP, ADInstruments, Sydney, Australia), and these have been compared with those provided by the commercial software incorporated in each ventilator. Thus, this paper intends to reflect on where the monitoring of patients with home NIMV should be headed.
On-screen Presentation of Ventilator Data; System Requirements
The first NIMV monitoring systems appeared in the market more than 10 years ago as an adaptation aimed at improving control over treatment compliance and its effectiveness in patients with sleep apnea syndrome and treatment with positive airway pressure by using a device fitted to the back of the ventilator. One of the first commercial models with this novelty (VPAP III, ResMed, Sydney, Australia) was able to download data, not only for compliance, but also for minute volume, respiratory rate, obstructive episodes and values for unintentional leaks. Its design incorporated a pulse-oximeter that was able to synchronize the data for lung mechanics with oxyhemoglobin saturation. Fig. 1 shows a tracing from this device.

In later years, and in part promoted by studies done in critical patients relating the presence of patient–ventilator pathologic interactions (asynchronies) with a greater degree of discomfort,8most software programs were already able to provide data for basic flow and pressure–time waves, breath-to-breath, with a screen resolution that gave, in most cases, a reliable reading of the tracings. But not all the manufacturers offered the same signal acquiring frequency, and at frequencies lower than 10Hz (10 points per second), some details of the chart with clinical transcendence may go unnoticed. An example of this is the simulation in Fig. 2.

Regarding the different forms of presentation graphics, most of the ventilators used in home NIMV can be connected to the patient with different tube systems (single or double), expiratory valves (pneumatic or controlled leak) and interfaces (nasal, oronasal, etc.). All these factors can modify the nature of the basic graphics and should be taken into account by the clinician when interpreting the morphology of said graphics, and by the manufacturers to provide a proper presentation.
Basic Graphics and Problems Associated With the Use of Different InterfacesFlow–Time Wave
Most patients who receive home NIMV in our setting are ventilated with pressure modes.5Therefore, the flow–time wave, as a variable dependent on pressure modes, will provide information about patient–ventilator interaction.
In the setting of critical patients or in anesthesiology, the presentation of the flow–time wave does not present any substantial problems. Practically all patients with endotracheal tubes are connected to ventilators with double-limb circuits (one for the inspired air from the ventilator and one for the expiratory circuit). Thus, by monitoring the inhaled and exhaled air with pneumotachography situated at the end of each of the circuits, a correct flow–time wave can be obtained without great inconvenience. In the same way, in non-invasive ventilators equipped with double-limb circuits, the presentation of the wave on the screen does not present much of a problem either.
The main difficulty for presenting flow waves appears when using single-limb ventilators with expiratory systems incorporated either in the tubing or in the interface itself. In this context, there is only one pneumotachograph, situated in the ventilator itself. In the trajectory of the air from the pneumotachograph to the patient and back, however, there are a series of physiological factors that distort the flow wave in its native morphology and require the use of algorithms for recreating what happens in the patient airway.
In pneumatic valve systems (occlusion of a valve during inspiration, which is opened during expiration), in the absence of re-inhalation, all the air exhaled air by the patient goes out through the valve, and therefore the information from the expiratory phase is inexistent. Thus, all the asynchronies that could be detected during expiration (ineffective effort, short cycling, etc.) are not visible to the clinician. Fig. 3 shows a flow–time wave with a pneumatic valve system and pneumotachograph situated between the ventilator and the valve. Evidently, if we need to monitor the entire graph, it will be necessary to place an additional pneumotachograph between the valve and the patient, which provides us with all the information about both phases or of the cycle. The problem of single-limb tubing especially affects the volumetric mode ventilators used in NIMV, in which the insufficient compensation of leaks determines that the system is functional without there being enough leak control.

In single-limb valve systems and leak control, the main drawback of the flow–time wave is that the flow (and therefore the volume) that circulates through the pneumotachograph during inspiration is the sum of the flow to the patient and the flow that escapes through the valve. During the expiratory phase, the opposite happens: the flow that reaches the pneumotachograph is that which is exhaled by the patient less that which escapes through the valve. The conclusion is clear: in the native mode, without correction, the inspiratory flow and therefore the volume are overestimated, while the flow and the volume during expiration are underestimated. It is necessary to incorporate a mathematic algorithm in the flow wave that estimates the flow that escapes through the valve during inspiration (in an ideal system with no unintentional leaks). Fig. 4 shows the native flow–time wave in a system with a leak valve. After the correction by means of a mathematical algorithm that takes into account the correlation between the pressure and the flow that escapes out the valve (available for each interface in the information provided by the manufacturer and transformable into a first-grade equation using a linear regression for pressure values between 4 and 20cmH2O), it is observed that the baseline (zero) of the flow corresponds exactly with the start of the inspiration.

Some of monitoring software programs does not make the previously mentioned correction, or perhaps it is done but incompletely. The result is a lower displacement of flow-point zero. Fig. 5A shows the tracing provided by commercial software with this problem. Fig. 5B demonstrates an alternative treatment of the tracing, simply with the suppression of the expiratory phase, still using a leak valve, with the same disadvantages as mentioned before (loss of expiratory-phase information).

Pressure–Time Wave
The pressure–time wave offers less technical problems than the flow–time wave. The main problem that may be present, both in single as well as double-limb systems, is attributable to the linear loss in pressure caused by the resistance and compliance of the tubing used. In order to increase the reliability of the pressure–time wave, some manufacturers have placed a supplemental proximal sensor in order to capture the pressure wave at said level. Another technical option requires a test prior to its use in the patient, while calculating the loss of pressure based on it according to the resistance and compliance of the tubing used. This option is incorporated in some of the newest ventilators.
Tidal Volume
Without a doubt, one of the most important variables to monitor in patients with home NIMV is tidal volume. All the software programs offer tidal volume readings obtained from the flow–time wave. Thus, the inconveniences which we referred to in the flow–time wave analysis would also be applicable to measuring tidal volume. Upon analyzing the different software packages, however, important differences can be seen in the manner of obtaining and presenting tidal volume measurements:
- –With presentation of the volume–time wave. Usually accompanied by the monitoring of the inspiratory volume by integrating the positive part of the flow–time wave. The value of the tidal volume in each cycle corresponds with the maximum value of the volume wave. This model of presentation has advantages and disadvantages. Among the advantages is that it discriminates, at least from a qualitative standpoint, the cycles in which there are leaks during inspiration from those that do not present leaks. As can be seen in Fig. 6, taken from an actual patient, the area under the curve (volume) of the positive part of the flow wave is much greater than that of the negative part, also presented on the screen; this suggests that there is a presence of leaks in said part of the cycle. Thus, as a consequence of the asymmetrical integration of the flow wave, the expiratory part of the volume wave is much less than the inspiratory part. The abrupt descent that is produced prior to the following inspiration is attributable to the restart of the integration of the flow wave. Usually, the restart is produced at the point at which the flow wave crosses zero, going from negative to positive. Without the said restart, in systems with inspiratory leaks, the volume wave does not return to baseline at each breath, so baseline would drift and it would be impossible to calculate the tidal volume. This scheme for monitoring inspiratory volume with presentation of the volume–time curve also shows additional drawbacks: first of all, the algorithm for modifying the native flow curve (monitored by the pneumotachograph inside the ventilator) must be exquisite in order to ensure the reliability of the tidal volume and, secondly, in cycles with inspiratory leak, the calculation of the actual tidal volume presents difficulties.

With no presentation of the volume–time curve. This format only offers a momentary reading of the estimation of the tidal volume, and it uses a program that integrates the expiratory part of the flow wave, meaning that it monitors expired tidal volume. As in the former situation, there are advantages and inconveniences. Among the advantages, what merits consideration is that the expired tidal volume is much less variable in presence of leaks, and the majority of the monitoring systems base leak monitoring on the expiratory cycle as a reference. Therefore, a priori, the exactness of the integration of the expiratory branch should be higher. There are significant disadvantages in this manner of estimation, however, and the main one appears in patients with nasal interface and who have a tendency to exhale air out their mouths. Fig. 7 shows an artificial model simulating an expiratory leak through a unidirectional valve. As can be seen, the monitored exhaled volume falls significantly, even if the patient were, presumably, ventilated with correct tidal volumes.

With regards to the reliability of tidal volume measurements, Contal et al.7 explore the correlation between the volume offered by the software of seven ventilators, comparing this with an external signal acquisition system. It should be noted that all the software of the ventilators studied underestimate the tidal volume and only one provides a correlation with the level of leaks in the experiment. As limitations of the paper by these authors, it should be mentioned that the analysis is not breath-to-breath and that the values obtained in the experimental model are not converted into the conditions of humidity and temperature of the human body (BTPS conditions), although some of the ventilators that are included in the study offer readings under these conditions.
Leaks
- –Basis for mathematical calculation. This is one of the main variables that should be precisely monitored in patients with NIMV. However, there are significant technical difficulties entailed in its measurement, depending on the interfaces used. With double-tubing systems, the difficulty is much less, given the fact that the difference between the inspired and expired volume is directly attributable to leaks. The situation changes if we use single-limb systems. In that case, there is then the problem of how to discriminate which is the flow proportion that circulates through the pneumotachograph as tidal volume and which proportion corresponds with leaks due to either the valve or accidental leaks.
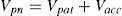
Therefore, the mathematic approach would be like Eq. (1):

where Vpn corresponds with the total flow (or volume) that circulates through the pneumotachograph, Vpat would correspond with the patient, Vve with the valve leaks and Vacc with accidental leaks.
The first step would be for the software to correct the flow due to the valve leaks, as shown in Fig. 4. This requirement can be met in two ways. In some ventilators used in critical care, there is the possibility of doing a “leak test” by manually occluding the interface connected to the ventilator, which gradually increases pressure, calculating for each point of pressure the leak through the interface. The second way would be to manually input in the software the type of interface that will be used and then the corresponding leak data. If we take into account that the level of leaks of a facial mask9 is approximately 20% higher than that of nasal prongs, it can easily be understood why it is important for the software to account for such data. One example of this is the tracing of Fig. 8, in which a leak is used that is equivalent to that of a face mask (50l/min at a pressure of 20cm H2O) in a simulation model without any other additional leak point. As can be seen, the system reports an accidental leak of 11l/min, which corresponds with the difference in flow between the standard nasal mask that the ventilator assumes that has been used and a facial mask.

The second step involves discriminating between an accidental leak with what we know to be the leak of the valve itself, with the following equation:
In other words, it is an equation system with two unknowns. The only points whose values we know are those in which we know one of the variables. Most software programs use for their estimation the transition between expiration and inspiration, where the patient flow is zero and, consequently, all the flow that circulates through the pneumotachograph corresponds to leaks. Aside from this value, the inspiratory leak is extrapolated. Fig. 9 illustrates this concept.

Problems with this model can appear when the leaks are proportionally more important in one of the two phases. For example, a poorly adjusted interface will have an additional proportionally greater leak during inspiration, when the pressure in the airway is greater and, inversely, in a patient with proper adjustment of a nasal interface but expiration through the mouth, the leak will be proportionally quite higher during said phase of the cycle. To date, this point has not been studied. Visually, however, and as has been mentioned before, a disproportionate leak on inspiration can be suspected when the inspiratory part of the flow is quite higher than the expiratory part or rather when, in the transition of the pressure wave from inspiration to expiration, the flow continues to be positive; in this latter circumstance, without the presence of leaks, the flow wave should cross over the zero point, coinciding with the transition to expiratory pressure.
- –Screen presentation. The way in which the software packages present the information on leaks also varies, depending on their design. Thus, while some manufacturers opt to offer on the screen the reading of the total leak (accidental+expiratory valve), others opt to give only the reading of the accidental leak. There are even some manufacturers who only offer the reading of the leak on expiration. Therefore, it is fundamental to discriminate the type of reading offered by each tool when interpreting a tracing.
In addition to the variations in the manner of giving readings, the visual presentation of the leaks is also variable. Most manufacturers opt to offer momentary readings at varying frequencies (from breath-to-breath, to the mean value of several breaths). On the other hand, other manufacturers offer readings of the wave of leaks, whose morphology is usually the same as that of the pressure.
Finally, as for reliability, the study by Contal et al.7 also explores the reliability of the reading of the leaks offered by seven ventilators, finding an important variability among them. While three of the ventilators offered a leak reading that was very close to the external measurement, the other four significantly underestimated the value of the leaks. One important disadvantage in the interpretation of the results is precisely the different form of on-screen presentation of the leaks depending on the manufacturer, as explained beforehand.
Correlation With Biological Variables
It goes that without saying that the ultimate objective of NIMV is to correct the respiratory failure that motivated its indication, not to obtain tracings on lung mechanics or the isolated analysis of patient–ventilator interaction. In fact, the standard for monitoring home NIMV during recent years has been night-time pulse-oximetry. Therefore, in addition to understanding the patient–ventilator interaction by means of the analysis of basic curves, it is necessary to evaluate the correlation between these and the biological variables measured, for example, with a non-invasive system for monitoring blood gases. In other words, there may be wave tracings of flow and pressure–time with many asynchronies, but with few repercussions in oximetry, and the opposite may also be seen.
With the current technology, the best parameter for a simple, fast and reliable correlation between charts of lung mechanics and biological variables is still pulse-oximetry. Alternative systems for non-invasive measurement of PaCO2 have disadvantages that add complexity to the analysis. Transcutaneous measurement of PaCO2 requires expensive tools, and the calibration and procedure are technically difficult,10 with a time delay for the detection of episodes of about 1min in the most modern models, which entails losing the information of the episodes that last less than 1min.11 These limitations would make home use cumbersome. Capnography in the expired air offers a fast breath-to-breath reading, but its interpretation is also not problem-free. In the first place, if end-tidal CO2 is to be used as a substitute for PaCO2, it should be kept in mind that, in patients with pulmonary parenchyma pathologies (especially in patients with COPD), the slope between tend tidal CO2 and arterial PaCO2 increases with the severity of the obstructive ventilatory disorder.12 In addition, in cases with expiratory leak (e.g. in patients with nasal mask and expiration through the mouth) there will be no signal for expired air.
Conclusions and Reflections for the Future
It is beyond question that monitoring home NIMV has experienced important qualitative advances with the development of software that uses the data stored in the internal memory of the ventilators. However, currently both the intrinsic complexity in interpreting the episodes that occur in patients who receive home NIMV as well as the lack of validation of commercial monitoring systems make it essential for there to be a consensus in order to determine the ideal system for monitoring in terms of validity and design. In our opinion, the following key points should be taken into account:
- –Discrimination of the variables necessary for correct monitoring: evidently, the information provided by the platforms should be sufficient, but not redundant. Monitoring variables such as inspiratory time, expiratory time, current volume and minute volume all at the same time cause a saturation of channels on the screen that make reading them all difficult. A screen that includes charts for flow, pressure and volume–time, leak calculation and a biological variable can be sufficient in clinical practice.
- –Adaptability to the different systems for tubing, expiratory valves and interfaces susceptible to being used for each patient. A priori, it would be ideal if the clinician could manually enter all the data that may alter monitoring for each patient.
- –Ease of use for the clinician. Unlike in sleep pathology, in ventilated patients the reading system has still yet to be determined. Reading over time periods (minute to minute) and the creation of indices of asynchronies, as has already been done in acute patients,8 may be easy to apply in patients with NIMV.
- –The incorporation of artificial intelligence for the automatic reading of tracings. Obviously, the manual reading of an average of 8h of nighttime tracings takes up a lot of time. The incorporation of algorithms for automated reading of the episodes associated with desaturation (leaks, residual obstruction of the upper airway, ineffective effort, etc.) could help clinical decision-making that improve the adaptation of the ventilator to the patient and, at the same time, would considerably widen the possibilities for researching the repercussions of the asynchronies in patients treated with NIMV.